


Abstract
Increased systemic levels of myeloperoxidase (MPO) are associated with the risk of coronary artery disease (CAD). To identify the genetic factors that are associated with circulating MPO levels, we carried out a genome-wide association study (GWAS) and a gene-centric analysis in subjects of European ancestry and African Americans (AAs). A locus on chromosome 1q31.1 containing the complement factor H (CFH) gene was strongly associated with serum MPO levels in 9305 subjects of European ancestry (lead SNP rs800292; P = 4.89 × 10−41) and in 1690 AA subjects (rs505102; P = 1.05 × 10⁻⁸). Gene-centric analyses in 8335 subjects of European ancestry additionally identified two rare MPO coding sequence variants that were associated with serum MPO levels (rs28730837, P = 5.21 × 10⁻¹²; rs35897051, P = 3.32 × 10⁻⁸). A GWAS for plasma MPO levels in 9260 European ancestry subjects identified a chromosome 17q22 region near MPO that was significantly associated (lead SNP rs6503905; P = 2.94 × 10⁻¹²), but the CFH locus did not exhibit evidence of association with plasma MPO levels. Functional analyses revealed that rs800292 was associated with levels of complement proteins in serum. Variants at chromosome 17q22 also had pleiotropic cis effects on gene expression. In a case–control analysis of ∼80 000 subjects from CARDIoGRAM, none of the identified single-nucleotide polymorphisms (SNPs) were associated with CAD. These results suggest that distinct genetic factors regulate serum and plasma MPO levels, which may have relevance for various acute and chronic inflammatory disorders. The clinical implications for CAD and a better understanding of the functional basis for the association of CFH and MPO variants with circulating MPO levels require further study.
INTRODUCTION
Myeloperoxidase (MPO) is a lysosomal enzyme stored within the azurophilic granules of circulating neutrophils, monocytes and tissue macrophages (1). It is released upon leukocyte (both neutrophils and monocytes) activation and generates various reactive oxidants and free radicals that play important roles in killing invading parasites and pathogens. The same MPO-derived oxidants have also been implicated in the formation of atherogenic low-density lipoprotein particles, the development of dysfunctional high-density lipoprotein (HDL) particles, catalytic consumption of nitric oxide, vascular endothelial injury, and development of atherosclerotic plaque and its clinical sequelae (2–4). Furthermore, high circulating levels of MPO, as measured in serum, plasma or leukocytes, predict major adverse cardiac events in healthy individuals, and in patients with coronary artery disease (CAD) or heart failure (5–8). In addition, MPO has been shown to be positively correlated with traditional and inflammatory CAD risk factors such as age, sex, blood pressure, body mass index, cigarette smoking, glucose, white blood cell count and C-reactive protein levels (9–11).
Heritability estimates for serum MPO range from 25 to 30% (9,12), suggesting that variation in serum MPO levels has a significant genetic component. Loss-of-function mutations in the MPO gene that result in total or partial MPO deficiency are rare in the population (∼1 in 2000) (13,14) and have been associated with increased susceptibility to infection as well as protection from CAD (15). Candidate gene studies have also identified common variants of MPO that have been associated with CAD as well as circulating MPO levels (16–19). However, a more complete understanding of the genetic factors controlling circulating MPO levels is still lacking. Therefore, the aim of the present study was to use large-scale unbiased genome-wide and targeted gene-centric analyses to identify loci controlling serum and plasma MPO levels and to determine whether MPO-associated variants influence the risk of CAD. To our knowledge, these analyses would represent the first genome-wide association study (GWAS) for circulating MPO levels.
RESULTS
GWAS for serum MPO levels
We first carried out a meta-analysis of GWAS data for serum MPO levels in 9305 subjects of European ancestry. The characteristics of the Cleveland Clinic GeneBank (GeneBank), the Coronary Artery Risk Development in Young Adults (CARDIA) Study, Cardiovascular Health Study (CHS), and Framingham Heart Study (FHS) cohorts and datasets used for these analyses are summarized in Table 1. The observed variability in MPO levels, which could have also been influenced by either sample storage-related effects or acute minor infections at the time of blood collection, made it difficult to harmonize MPO assays across cohorts. Therefore, single-nucleotide polymorphism (SNP) association results were combined using an effective sample-weighted Z-score meta-analysis method. The quantile–quantile (Q–Q) and Manhattan plots for serum MPO levels are presented in Figure 1A and B. The observed genomic control factors in the four discovery cohorts were near unity (GeneBank = 0.999; CHS = 1.015; FHS = 1.004; CARDIA = 1.004), suggesting that the GWAS results were not strongly confounded by underlying population stratification. SNPs at three loci on chromosomes 1q31.3, 6p21.32 and 20p13 exceeded the pre-specified threshold for genome-wide significance (5.0 × 10⁻⁸). The characteristics of the lead SNPs at these three loci and their association with serum MPO levels are summarized in Table 2 and Supplementary Material, Table S2. The lead SNP at 1q31.3, rs800292 (P = 4.89 × 10−41), is a non-synonymous Val62Ile (GTA>ATA) substitution in the complement factor H gene (CFH) with a minor allele frequency (MAF) of 0.23 in Europeans. The CFH-CFHR3-CFHR1 genomic region on chromosome 1q31.3 contains several other variants that were also significantly associated with serum MPO levels, which show varying levels of linkage disequilibrium (LD) with rs800292 (Fig. 2A). Of note, rs800292 is in low LD with other CFH variants, such as rs1061170 (Tyr402His), previously identified as susceptibility alleles for other disease phenotypes (Supplementary Material, Table S3). To determine whether the other SNPs in this region represent independent association signals, we also ran analyses taking into the account the effect of the lead SNP rs800292. These conditional analyses revealed that the strength of the association for the other SNPs in this region was attenuated and did not exceed the genome-wide threshold for significance (Supplementary Material, Table S3). Using the GeneBank cohort, we also analyzed the loci associated with serum MPO levels with further adjustment for CAD, history of hypertension, lipid levels, or white blood cell count. However, these additional adjustments did not alter the effect estimates or P-values compared with those adjusted for only age and sex (data not shown).
Description of cohorts and datasets used in this study
| Cohort | Ethnicity | N | Age (year) | M/F | MPO levels (pmol/l) | Source (Assay) | Genotyping platform | Number of SNPs |
|---|---|---|---|---|---|---|---|---|
| GeneBank | European | 2189 | 62.5 ± 11.2 | 1554/635 | 760.1 ± 719.5 | Serum (CardioMPO) | Affymetrix 6.0 (Imputed) | 2 421 770 |
| European | 2191 | 62.5 ± 11.2 | 1555/636 | 225.5 ± 293.9 | Plasma (CardioMPO) | Affymetrix 6.0 (Imputed) | 2 421 770 | |
| CHS | European | 2667 | 71.9 ± 5.0 | 1028/1639 | 345.6 ± 280.1 | Serum (CardioMPO) | Illumina CNV370 (Imputed) | 2 397 181 |
| European | 3085 | 72.2 ± 5.2 | 1327/1758 | 353.1 ± 318.6 | Serum (CardioMPO) | IBCv2 SNP array | 46 423 | |
| AAs | 643 | 72.8 ± 5.6 | 238/405 | 382.1 ± 330.7 | Serum (CardioMPO) | IBCv2 SNP array | 47 046 | |
| FHS | European | 2940 | 61.0 ± 9.5 | 1359/1581 | 334.3 ± 218.8 | Serum (OXIS) | Affymetrix 500 K (Imputed) | 2 486 777 |
| European | 2660 | 61.0 ± 9.5 | 1218/1442 | 335.4 ± 220.1 | Serum (OXIS) | IBCv2 SNP array | 46 930 | |
| CARDIA | European | 1509 | 25.6 ± 3.3 | 701/808 | 137.0 ± 97.0 | Serum (CardioMPO) | Affymetrix 6.0 (Imputed) | 2 409 479 |
| European | 1262 | 40.7 ± 3.3 | 580/682 | 139.1 ± 98.2 | Serum (CardioMPO) | IBCv2 SNP array | 46 506 | |
| AAs | 1047 | 39.5 ± 3.8 | 440/607 | 108.4 ± 85.6 | Serum (CardioMPO) | IBCv2 SNP array | 46 346 | |
| MONICA/ KORA | European | 1328 | 52.7 ± 10.6 | 700/628 | 134.2 ± 67.5 | Serum (Mercodia) | IBCv2 SNP array | 44 142 |
| GHS I | European | 2996 | 55.8 ± 10.9 | 1453/1543 | 327.7 ± 189.6 | Plasma (CardioMPO) | Affymetrix 6.0 (Imputed) | 2 614 503 |
| GHS II | European | 1178 | 55.1 ± 10.9 | 589/589 | 290.9 ± 132.7 | Plasma (CardioMPO) | Affymetrix 6.0 (Imputed) | 2 612 433 |
| LURIC1 | European | 794 | 59.9 ± 12.0 | 523/271 | 241.2 ± 71.0 | Plasma (Immundiagnostik) | Affymetrix 500 K (Imputed) | 5 979 070 |
| LURIC2 | European | 2100 | 63.5 ± 10.0 | 1488/610 | 174.0 ± 61.6 | Plasma (Immundiagnostik) | Affymetrix 6.0 (Imputed) | 6 420 716 |
Significant and suggestive loci associated with decreased circulating MPO levels in the GWAS and gene-centric analyses
| Locus [nearest Gene(s)] | Lead SNP | Position (bp)a | Effect/Other alleleb | EAF | Beta (SE) | P-value | MPO Levels | Ethnicity | Analysis | I2-statistic |
|---|---|---|---|---|---|---|---|---|---|---|
| 1q31.3 (CFH) | rs800292 | 194 908 856 | A/G | 0.23 | −0.15 (0.01) | 4.89 × 10−41 | Serum | European | GWAS | 89.7 |
| 6p21.32 (NOTCH4-C2-HLA) | rs3134931 | 32 298 598 | T/C | 0.73 | −0.05 (0.01) | 1.49 × 10−08 | Serum | European | GWAS | 0 |
| 20p13 (SIRPB2) | rs6042507 | 1 407 060 | A/C | 0.11 | −0.09 (0.02) | 4.30 × 10−08 | Serum | European | GWAS | 38.5 |
| 1q42.13 (GALNT2) | rs2144300 | 228 361 539 | C/T | 0.39 | −0.05 (0.01) | 2.52 × 10⁻⁶ | Serum | European | GWAS | 34.5 |
| 8p21.3 (ATP6V1B2-LZTS1) | rs1390943 | 20 126 170 | G/T | 0.33 | −0.05 (0.01) | 9.38 × 10⁻⁷ | Serum | European | GWAS | 30.9 |
| 1q31.3 (CFH) | rs6680396 | 194 899 093 | G/A | 0.22 | −0.13 (0.01) | 6.65 × 10−43 | Serum | European | IBC | 88.5 |
| 6p21.32 (C2) | rs9332739 | 32 011 783 | C/G | 0.044 | −0.12 (0.02) | 4.83 × 10⁻¹⁰ | Serum | European | IBC | 0 |
| 17q22 (MPO) | rs28730837 | 53 710 396 | T/C | 0.014 | −0.27 (0.04) | 5.21 × 10⁻¹² | Serum | European | IBC | 21.6 |
| 17q22 (MPO) | rs35897051 | 53 703 225 | C/A | 0.007 | −0.31 (0.06) | 3.32 × 10⁻⁸ | Serum | European | IBC | 63.9 |
| 17q22 (TRIM37) | rs8081967 | 54 427 483 | T/C | 0.36 | −0.05 (0.01) | 2.13 × 10⁻⁶ | Serum | European | IBC | 37.5 |
| 1q42.13 (GALNT2) | rs2144300 | 228 361 539 | C/T | 0.39 | −0.04 (0.01) | 2.52 × 10⁻⁷ | Serum | European | IBC | 0 |
| 1q31.3 (CFH) | rs505102 | 194 886 125 | G/A | 0.71 | −0.15 (0.03) | 1.05 × 10⁻⁸ | Serum | AAs | IBC | 0 |
| 1q23.3 (DARC) | rs2814778 | 157 441 307 | G/A | 0.78 | −0.21 (0.04) | 6.48 × 10⁻⁸ | Serum | AAs | IBC | 44.3 |
| 17q22 (C17orf71) | rs6503905 | 54 642 236 | A/G | 0.37 | −0.06 (0.01) | 2.94 × 10⁻¹² | Plasma | European | GWAS | 39.7 |
| 17q22 (RNF43) | rs2680701 | 53 793 300 | G/A | 0.81 | −0.06 (0.01) | 4.98 × 10⁻¹⁰ | Plasma | European | GWAS | 42.4 |
| 17q22 (PPM1E) | rs9911753 | 54 337 956 | G/A | 0.39 | −0.05 (0.01) | 1.51 × 10⁻⁹ | Plasma | European | GWAS | 44.7 |
| 17q22 (MPO) | rs12940923 | 53 724 848 | A/T | 0.84 | −0.07 (0.01) | 3.85 × 10⁻⁹ | Plasma | European | GWAS | 44.5 |
| 1q42.13 (ABCB10-TAF5L-URB2-GALNT2) | rs12049351 | 227 784 624 | C/G | 0.79 | −0.05 (0.01) | 1.08 × 10⁻⁶ | Plasma | European | GWAS | 0 |
aSNP base pair (bp) positions are given according to NCBI build 36.1 of the reference human genome sequence.
bThe allele that lowers MPO levels is referred to as the effect allele. Units for betas are natural log-transformed circulating MPO levels in pmol/l.
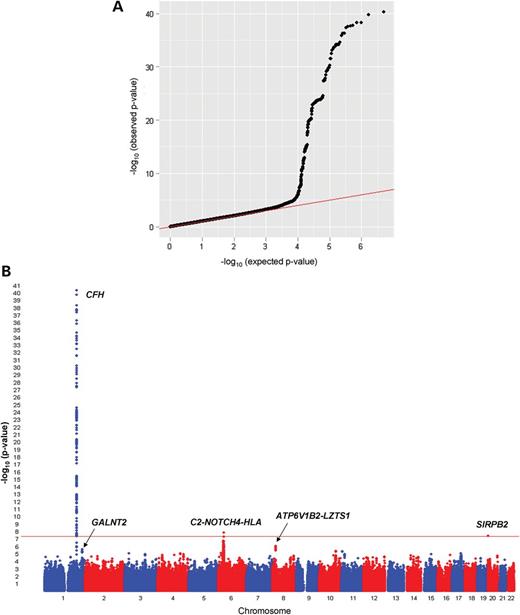
Results of the GWAS for serum MPO levels in subjects of European ancestry. The Q–Q (A) and Manhattan (B) plots are shown for the meta-analysis of 9305 subjects from the GeneBank, CHS, FHS and CARDIA cohorts.
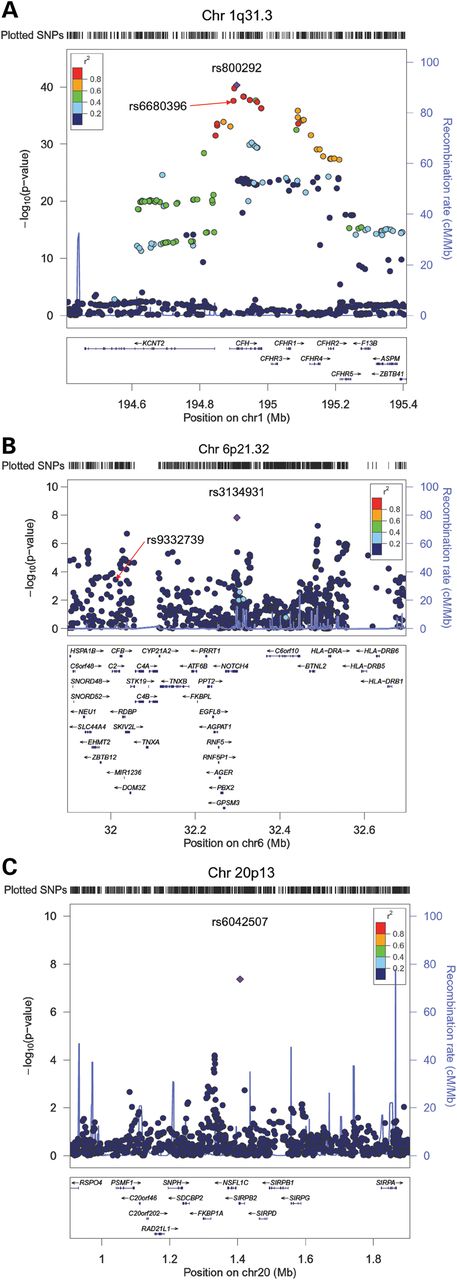
Regional plots for loci demonstrating a significant association with serum MPO levels on chromosomes 1q31.3 (A), 6p21.32 (B), and 20p13 (C). For each locus, a 1 Mb region is shown, centered on the lead SNP (purple diamond). Genes in the selected intervals are indicated in the bottom panel.
The locus on chromosome 6p21.32 contains several immune system related genes, including complement component 2 (C2) and HLA (Fig. 2B). The lead SNP (rs3134931; P = 1.49 × 10⁻⁸) is located within intron 2 of NOTCH4 and is not in strong LD (r2 < 0.4) with any of the other 130 variants in this region that demonstrate suggestive (P < 5.0 × 10⁻⁶) association with serum MPO levels (Fig. 2B). One SNP at chromosome 20p13, which is not in LD (r2 < 0.2) with other variants in this region, was also significantly associated with serum MPO levels (rs6042507; P = 4.30 × 10⁻⁸) (Fig. 2C). This SNP encodes a non-synonymous Ala215Glu substitution (GCG>GAG) in exon 3 of the signal-regulatory protein beta 2 gene (SIRPB2), which belongs to the family of genes expressed predominantly in neutrophils and monocytes. Suggestive evidence of association with serum MPO levels was also observed on chromosome 1q42.13 (rs2144300; P = 2.52 × 10⁻⁶) containing N-actetylgalactosaminyltransferase 2 (GALNT2) and a region on 8p21.3 (rs1390943; P = 9.38 × 10⁻⁷) containing the vacuolar proton ATPase subunit B (ATP6V1B) and leucine zipper putative tumor suppressor 1 (LZTS1) genes (Fig. 1B; Table 2; Supplementary Material, Table S2).
Gene-centric analyses for serum MPO levels
Using CARe data from the CARDIA (n = 1262), CHS (n = 3085) and FHS (n = 2660) cohorts, as well as 1328 additional subjects of European ancestry from the Monitoring of Trends and Determinants in Cardiovascular Disease Cooperative Health Research in the Region of Augsburg (MONICA/KORA) cohort, we carried out gene-centric analyses using the IBC 50K custom SNP array. This chip has dense SNP coverage for ∼2100 CAD candidate genes, including CFH, C2 and GALNT2 (but not NOTCH4 or SIRBP2) and contains specific rare amino acid substitutions that would otherwise not be captured by imputed GWAS datasets. As a result, the gene-centric analyses allowed us to validate and fine map a subset of the loci identified in the GWAS meta-analysis, as well as potentially identify other variants associated with serum MPO levels.
As shown in Table 2 and Supplementary Material, Table S4, a strong association of serum MPO levels was observed with variants in CFH where the lead SNPs yielded P-values of 6.65 × 10−43 (rs6680396) and 4.74 × 10−42 (rs505102). The rs6680396 and rs505102 variants are in high LD (r2 = 0.87) with each other in subjects of European descent (based on the 1000 Genome Project CEU data), and also with the lead SNP identified in the GWAS for serum MPO levels (rs800292). A combined analysis of the CFH locus using all available unique individuals in the GWAS and IBC datasets, including the GeneBank cohort (combined n = 10 524), further strengthened the association of rs6680396 with serum MPO levels (P = 9.34 × 10−45). The gene-centric analyses also identified an SNP on chromosome 6p21.32 (rs9332739) in C2 that was strongly associated with serum MPO levels (P = 4.83 × 10⁻¹⁰) (Table 2; Supplementary Material, Table S4). Rs9332739 (MAF = 0.044) encodes a non-synonymous Glu318Asp (GAG>GAC) substitution in C2 and is located ∼287 kb proximal to the lead SNP (rs3134931) in NOTCH4 that was identified in the GWAS for serum MPO levels (Fig. 2B). However, in an analysis that included GeneBank (combined n = 10 524) the association of rs9332739 with serum MPO levels was less significant than in the IBC analyses (P = 1.76 × 10⁻⁷), as this variant was not associated with serum MPO levels in GeneBank (P = 0.39). The gene-centric analyses also identified two rare variants (MAF ∼1%) of MPO (the structural gene for the enzyme) on chromosome 17q22 that were significantly associated with serum MPO levels (Table 2; Supplementary Material, Table S4). One SNP encodes an Ala332Val substitution (rs28730837; GCG>GTG; P = 5.21 × 10⁻¹²) and the other interrupts the first position (AG>CG) of the 3′ splice junction of intron 11 (rs35897051; P = 3.32 × 10⁻⁸). Since these rare variants were specifically included on the IBC array and not present in any of the imputed GWAS datasets, we were not able to carry out a combined analysis with all subjects. In addition to these rare variants, another SNP (rs8081967, MAF = 0.36) located ∼724 kb telomeric to MPO in intron 23 of TRIM37 exhibited suggestive evidence of association (P = 2.13 × 10⁻⁶) with serum MPO levels (Table 2; Supplementary Material, Table S4). Of note, rs8081967 also demonstrated suggestive evidence in the GWAS analyses of serum MPO levels (P = 6.59 × 10⁻⁵), which reached significance (P = 1.44 × 10⁻⁸) in an analysis using all unique subjects in the GWAS and IBC datasets (combined n = 10 524). In addition, we also observed suggestive evidence of association with rs2144300 in GALNT2 (P = 2.52 × 10⁻⁷) in the IBC analyses (Table 2; Supplementary Material, Table S4), but this association did not achieve genome-wide significance (P = 2.68 × 10⁻⁷) in a combined analysis with all unique subjects in the GWAS and IBC datasets (n = 10 524).
Replication of loci for serum MPO levels in African Americans (AAs)
To replicate the association findings observed with serum MPO levels and determine whether the loci have similar effects on other ethnicities, we used IBC SNP array data available in 1690 African Americans (AAs) from the CARDIA (n = 1047) and CHS (n = 643) cohorts. Consistent with the results on subjects of European ancestry, rs505102 in CFH was significantly associated (P = 1.05 × 10⁻⁸) with serum MPO levels in AAs (Table 2; Supplementary Material, Table S5), thus providing independent validation of this locus in a different ethnic group. The IBC analyses in AAs also yielded suggestive evidence for association of serum MPO levels with rs2814778 (P = 6.48 × 10⁻⁸) (Table 2; Supplementary Material, Table S5), which is located in the 5′ UTR of the Duffy blood group antigen gene (DARC) on chromosome 1q23.3. Because rs2814778 is an important determinant of circulating neutrophil count in AAs, we further adjusted this analysis for white blood count. The association was strongly attenuated (P = 0.02), suggesting that the association of rs2814778 with serum MPO in AAs is largely mediated through the number of circulating neutrophils. In addition to validating the association of CFH with serum MPO levels observed in subjects of European ancestry, there was supportive evidence in AAs for association of serum MPO levels with rs9332739 in C2 (P = 0.0045) and the rare Ala332Val (rs28730837) substitution in MPO (P = 0.061) (Supplementary Material, Table S5), but not with the other variant in MPO (rs35897051; P = 0.93) or with rs2144300 in GALNT2 (P = 0.77).
GWAS for plasma MPO levels
We next carried out a GWAS meta-analysis for plasma MPO levels in subjects of European ancestry from the GeneBank, Gutenberg Health Study (GHS), and Ludwigshafen Risk and Cardiovascular Health (LURIC) cohorts (total n = 9260). The Q–Q and Manhattan plots for the plasma MPO analyses are shown in Figure 3A and B, and the genomic control factors were 0.999, 1.008, 0.980, 0.970 and 0.991 for the GeneBank (n = 2191), GHS I (n = 2997), GHS II (n = 1178), LURIC1 (n = 794) and LURIC2 cohorts (n = 2100), respectively. The most significant locus for plasma MPO levels mapped to chromosome 17q22 near MPO with the lead SNP (rs6503905) yielding a P-value of 2.94 × 10⁻¹² (Fig. 3B, Table 2; Supplementary Material, Table S6). The variant, rs6503905 (MAF = 0.37), encodes a putative synonymous substitution (GCG>GCA; Ala14Ala) in the predicted gene C17orf71, which is located ∼930kb telomeric of MPO. As shown in Figure 3C and Supplementary Material, Table S6, several other SNPs spanning an ∼1 Mb interval in this region and within different LD blocks were also significantly associated with plasma MPO levels, including rs9911753 (P = 1.51 × 10⁻⁹), rs2680701 (P = 4.98 × 10⁻¹⁰), and rs12940923 (P = 3.85 × 10⁻⁹). However, rs6503905 is only in moderate LD with rs9911753 (r2 = 0.28) and completely unlinked to rs2680701 and rs12940923 (r2 < 0.1 for each SNP). In addition, rs9911753 is in strong LD (r2 = 0.87) with rs8081967, which was identified in our combined GWAS/IBC analyses for serum MPO levels (Table 2). We next re-performed the analyses conditioned on rs6503905, rs9911753, rs2680701 or rs12940923. The association of these SNPs with plasma MPO was attenuated when conditioned on each other, with only rs6503905 exceeding the genome-wide threshold for significance (P = 9.07 × 10⁻⁹) when the analyses were conditioned on rs12940923 (Supplementary Material, Table S7).
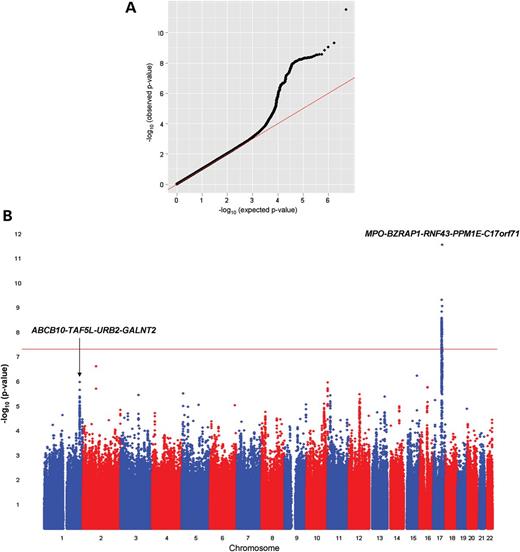
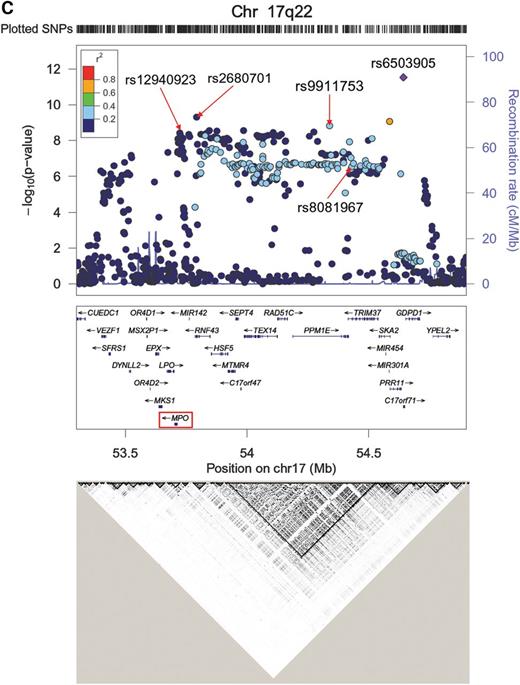
Results of the GWAS for plasma MPO levels in subjects of European ancestry. The Q–Q (A) and Manhattan (B) plots are shown for the meta-analysis of 9260 subjects from the GeneBank, GHS I, GHS II, LURIC1 and LURIC2 cohorts. (C) Regional plot of a 1 Mb interval on chromosome 17q22 demonstrates several independent SNPs that exceed the genome-wide threshold for significance. The bottom panel shows the LD pattern across this region using CEU data from HAPMAP.
In addition to the chromosome 17q22 locus, we also observed suggestive evidence for association of plasma MPO levels with the region surrounding GALNT2 (Fig. 3B; Table 2; Supplementary Material, Table S6), although the lead SNP (rs12049351; P = 1.08 × 10⁻⁶) differs from that identified for serum MPO levels in the GWAS/IBC analyses (rs2144300). Rs12049351 is not in LD with rs2144300 and is located ∼485 kb proximal to GALNT2 in between ABCB10 and TAF5L. We also evaluated the reciprocal association of all identified SNPs that were available across all genotyping platforms/datasets with both plasma and serum MPO levels. SNPs identified in our GWAS for plasma MPO levels also demonstrated varying degrees of association with serum MPO levels, whereas reciprocal associations were not observed with plasma MPO levels (Supplementary Material, Table S8). Since the SNPs on chromosome 17q22 and rs12049351 at the ABCB10-TAF5L-GALNT2 locus demonstrated association with both serum and plasma MPO levels (Supplementary Material, Table S8), we also carried out a meta-analysis across all independent subjects (combined n = 16 376). These analyses yielded P-values of 1.5 × 10⁻¹¹ and 5.4 × 10⁻⁹ for association of rs6503905 and rs12049351, respectively, with circulating MPO levels.
Functional effects of MPO-associated variants
To determine whether any of the identified SNPs were functional, we carried out biochemical and expression quantitative trait locus (eQTL) analyses. For the rs800292 variant in CFH, we measured serum levels of C3a-desArg, a downstream cleavage product of complement activation, in a subset of 171 subjects from the GeneBank cohort. These GeneBank subjects were selected to represent equal numbers of the GG, AG, and AA genotypes for rs800292 (n = 57 each) and matched for age, sex and CAD status. As shown in Figure 4, serum C3a-desArg levels were significantly lower in carriers of the A allele compared with GG homozygotes in a dose-dependent manner (P = 0.04). To further evaluate the functional effects of SNPs associated with circulating MPO levels, we used previously generated microarray data in monocytes from 1467 subjects in the GHS I and II cohorts (20). Significant and directionally consistent cis eQTLs were observed with SNPs located on chromosome 17q22 and mRNA levels of MPO as well as several other genes in this region, including RAD51C, SEPT4 and TRIM37 (Table 3). For MPO and RAD51C, these associations remained significant even after conditioning on the lead eQTL SNPs, which suggest that this region may have pleiotropic effects on the expression of multiple genes. No significant eQTL associations were detected with SNPs at other loci that were associated with serum or plasma MPO levels, including the CFH locus on chromosome 1.
Pleiotropic associations of chromosome 17q22 SNPs with gene expression in monocytes
| Gene | SNP | Effect/Other Allele | Beta (SE) | P-value | aConditioned Beta (SE) | aConditioned P-value | MPO levels |
|---|---|---|---|---|---|---|---|
| MPO | rs12940923 | A/T | −0.25 (0.02) | 8.49 × 10⁻³⁵ | – | – | Plasma |
| rs2680701 | G/A | −0.19 (0.02) | 7.42 × 10⁻²⁵ | −0.04 (0.03) | 0.191 | Plasma | |
| rs6503905 | A/G | −0.08 (0.02) | 4.32 × 10⁻⁷ | −0.04 (0.02) | 0.007 | Plasma | |
| rs9911753 | G/A | −0.07 (0.01) | 3.36 × 10⁻⁷ | −0.02 (0.01) | 0.089 | Plasma | |
| rs8081967 | T/C | −0.07 (0.01) | 3.57 × 10⁻⁶ | −0.02 (0.01) | 0.115 | Serum | |
| SEPT4 | rs9911753 | G/A | −0.09 (0.02) | 7.43 × 10⁻⁷ | – | – | Plasma |
| rs8081967 | T/C | −0.08 (0.02) | 8.64 × 10⁻⁶ | −0.01 (0.05) | 0.769 | Serum | |
| RAD51C | rs9911753 | G/A | −0.09 (0.01) | 1.92 × 10−39 | – | – | Plasma |
| rs8081967 | T/C | −0.09 (0.01) | 2.16 × 10⁻³⁵ | −0.02 (0.02) | 0.369 | Serum | |
| rs6503905 | A/G | −0.09 (0.01) | 5.18 × 10⁻³⁰ | −0.03 (0.01) | 0.003 | Plasma | |
| rs2680701 | G/A | −0.05 (0.01) | 3.65 × 10⁻⁷ | −0.10 (0.01) | 4.84 × 10⁻²⁸ | Plasma | |
| rs12940923 | A/T | −0.05 (0.01) | 3.29 × 10⁻⁶ | −0.10 (0.01) | 1.69 × 10⁻²¹ | Plasma | |
| TRIM37 | rs8081967 | T/C | −0.05 (0.01) | 1.67 × 10⁻¹⁴ | – | – | Serum |
| rs9911753 | G/A | −0.04 (0.01) | 2.12 × 10⁻¹¹ | −0.02 (0.02) | 0.341 | Plasma | |
| rs6503905 | A/G | −0.04 (0.01) | 7.36 × 10⁻⁸ | −0.001 (0.01) | 0.909 | Plasma |
aConditioned on lead eQTL SNP for each gene. Units for betas are log2-transformed signal intensities obtained from Illumina HT-12 v3 microarrays. eQTL results are only shown for SNPs identified in the GWAS for plasma levels and for which data were available in the monocyte dataset.
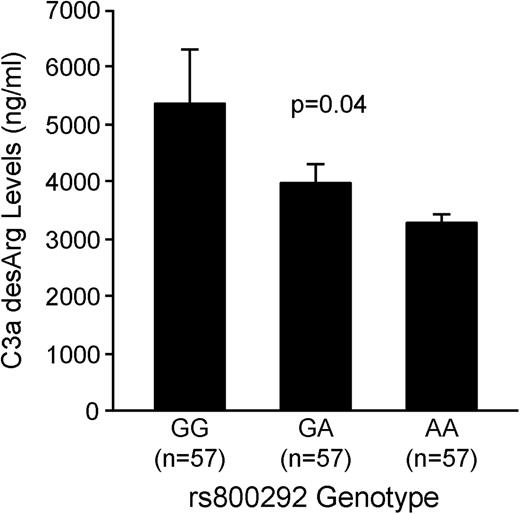
Serum C3a-desArg levels as a function of CFH rs800292 genotype. Serum levels of C3a-desArg are significantly lower in carriers of the A allele compared with GG homozygotes in a dose-dependent manner. Data were measured in a subset of age-, sex- and CAD status-matched GeneBank subjects and shown as untransformed mean ± SE. The P-value was obtained using linear regression analyses with natural-log transformation.
Effects of MPO-associated variants on the risk of CAD
To further investigate the significance of the loci for circulating MPO levels, we evaluated the association of the identified SNPs with prevalent CAD using the CARDIoGRAM consortium. This consortium represents a GWAS meta-analysis of subjects with history of CAD and is comprised of ∼22 000 cases and ∼65 000 controls. As shown in Table 4, none of the SNPs for which CARDIoGRAM data were available showed significant evidence of association with prevalent CAD.
MPO-associated SNPs and risk of CAD in the CARDIoGRAM consortium
| MPO Levels (Analysis) | Locus (Nearest Gene(s)) | SNP | Allele | Frequency | OR (95% CI) | P-value | n |
|---|---|---|---|---|---|---|---|
| Serum (GWAS) | 1q31.3 (CFH) | rs800292 | G | 0.74 | 0.99 (0.96–1.03) | 0.71 | 78 841 |
| Serum (GWAS) | 1q42.13 (GALNT2) | rs2144300 | C | 0.40 | 1.03 (1.0–1.06) | 0.06 | 83 756 |
| Serum (GWAS) | 8p21.3 (ATP6V1B2-LZTS1) | rs1390943 | G | 0.33 | 0.99 (0.96–1.02) | 0.57 | 78 176 |
| Serum (IBC) | 1q31.3 (CFH) | rs6680396 | G | 0.23 | 1.01 (0.98–1.05) | 0.43 | 81 028 |
| Serum (IBC) | 6p21.32 (C2) | rs9332739 | C | 0.08 | 1.00 (0.94–1.07) | 0.98 | 79 862 |
| Serum (IBC) | 17q22 (TRIM37) | rs8081967 | C | 0.65 | 1.01 (0.98–1.03) | 0.75 | 80 337 |
| Plasma (GWAS) | 17q22 (C17orf71) | rs7502947a | G | 0.34 | 0.99 (0.96–1.02) | 0.37 | 71 939 |
| Plasma (GWAS) | 17q22 (RNF43) | rs2680701 | G | 0.80 | 1.00 (0.96–1.03) | 0.91 | 76 793 |
| Plasma (GWAS) | 17q22 (PPM1E) | rs9911753 | G | 0.39 | 1.00 (0.97–1.03) | 0.91 | 82 162 |
| Plasma (GWAS) | 17q22 (MPO) | rs12940923 | T | 0.15 | 1.03 (0.99–1.07) | 0.16 | 82 301 |
| Plasma (GWAS) | 1q42.13 (ABCB10-TAF5L-URB2-GALNT2) | rs12049351 | C | 0.80 | 0.97 (0.94–1.01) | 0.12 | 83 470 |
Results are only shown for index SNPs or proxy variants that were available in the CARDIoGRAM Consortium.
aUsed as proxy for rs6503905 (r2 = 0.70).
DISCUSSION
Using meta-analyses of both GWAS and gene-centric data, we identified distinct loci that were associated with serum and plasma MPO levels. The most significant locus for serum MPO levels in subjects of European ancestry was observed with CFH on chromosome 1, which was replicated in AA subjects. Of the three highly associated and linked CFH SNPs in subjects of European ancestry (rs505102, rs800292 and rs6680396), only rs505102 and rs800292 are in strong LD in AAs. As a result of this different LD pattern, candidate causal SNPs responsible for the association with lower serum MPO levels could include rs505102, rs800292 or another SNP in LD with these variants. Of these, rs800292 encodes a Val62Ile substitution in CFH and has been previously associated with decreased risk of age-related macular degeneration (AMD) in a Japanese population (21). Other CFH variants have also been associated with AMD (22–25), as well as meningococcal susceptibility (26), IgA-induced nephropathy (27), atypical hemolytic uremic syndrome (HUS) (28), membranoproliferative glomerulonephritis type II (29) and systemic lupus erythematosis (SLE) (30). However, it is not known whether MPO plays a biological role in these inflammatory diseases. In addition, the association of the other disease-associated CFH variants with serum MPO levels was attenuated when the analyses were conditioned on rs800292, even though these SNPs are in weak LD (r2 < 0.30) with rs800292 in subjects of European ancestry. Thus, while several independent alleles at the CFH locus influence multiple inflammatory-related disease phenotypes, the strong association signal at this locus with serum MPO levels is primarily due to rs800292 or other tightly linked variants.
Complement fixation is well known as a potent trigger of leukocyte activation and degranulation, and serum generation is associated with activation of protease cascades, including complement proteins, such as C3a and C3b (31–33). Thus, an association between a genetic variant for a complement protein and serum MPO levels, but not plasma MPO levels, can be mechanistically rationalized and could be related to leukocyte activation and partial degranulation during blood coagulation. A role for the complement system in influencing serum MPO levels is also supported by the results of our gene-centric analyses, which identified an amino acid substitution in C2 (rs9332739) for serum MPO levels that has also been previously associated with AMD (34). The minor alleles of rs800292 in CFH and rs9332739 in C2 protect against the development of AMD and are associated with decreased serum MPO levels. The disease protective Ile62 CFH variant (rs800292), which is located within the SCR2 domain, has been shown to increase binding of CFH to C3b and lead to greater inactivation of fluid-phase and surface-bound C3b (35). Presumably, this would reduce complement activation and leukocyte activation during serum separation, thereby leading to decreased MPO release from neutrophils and/or monocytes. This notion is consistent with our functional data, showing that the A allele of rs800292, which is associated with decreased MPO levels, is associated with lower serum levels of C3a-desArg, a cleavage product generated by complement activation. In addition, clotting factors and proteases that activate complement proteins and trigger degranulation of MPO-rich phagocytes, such as neutrophils, are present in serum but are mostly depleted in plasma. Therefore, CFH and C2 variants that decrease complement activation, either through increased CFH or reduced C2 activity, could be one potential mechanism through which they lead to decreased MPO levels in serum. By analogy, a common Asp42Gly variant of DARC has been associated with serum, but not plasma, concentrations of several pro-inflammatory chemokines (36). The mechanism appears to be due to the release of these chemokines during blood coagulation as a result of differential binding to DARC (36).
Whether the association of complement pathway variants with AMD (and other inflammatory diseases) may be causally related to enhanced MPO-related inflammatory processes remains to be determined. MPO variants, including those identified herein, have not been reported to be associated with AMD, meningococcal susceptibility, IgA-induced nephropathy, HUS, membranoproliferative glomerulonephritis type II or SLE, suggesting that circulating MPO levels may not play a causal role in the pathogenesis of such inflammatory diseases. On the other hand, MPO-induced oxidative damage to lipoproteins and the vascular wall have been implicated in the development of atherosclerosis and its clinical sequelae, and systemic levels of MPO predict cardiovascular risk. Oxidative stress and lipid peroxidation are also involved in other chronic inflammatory diseases, including AMD. In addition to regulating the complement system, CFH is a major binding protein of malondialdehyde, a common lipid peroxidation product (37). Taken together, these observations may mechanistically link stress-related oxidative tissue injury to localized regulation of complement activity in a variety of chronic inflammatory disorders.
In addition to loci containing genes of the complement system, the region containing SIRPB2 also demonstrated genome-wide significant association with serum MPO levels in subjects of European ancestry. SIRPB2 is a member of the signal-regulatory protein (SIRPs) family of transmembrane glycoproteins that are expressed predominantly on myeloid cells and involved in the regulation of innate immunity and complement receptor-mediated phagocytosis (38). The role of SIRPB2 in antigen-specific proliferation and activation of T-cells (39) may provide an additional biological link for its association with serum MPO levels. By comparison, the gene-centric analyses in AA subjects identified a promoter variant of DARC (rs2814778) that achieved near genome-wide significance for association with serum MPO levels. Interestingly, the G allele of this variant is highly prevalent in subjects of African descent and results in the loss of the Duffy antigen on red blood cells, which has been associated with resistance to malaria infection (40) and low neutrophil count (41). Thus, this is consistent with our observations that the A allele of rs2814778 is associated with increased serum MPO levels since MPO is most abundantly present in neutrophils.
As a comparative analysis, we also carried out a GWAS for plasma MPO levels in subjects of European descent. These results identified multiple SNPs in a large ∼1 Mb interval encompassing MPO on chromosome 17q22 that demonstrated association with both plasma and serum MPO levels. These results are further supported by our gene-centric analyses, which identified rare MPO SNPs that were also associated with serum MPO levels, including the previously reported rs28730837 Ala332Val substitution (9). In contrast, the CFH locus only demonstrated association with MPO levels in serum. Based on the LD structure in the chromosome 17q22 region, the four SNPs that we identified are not tightly linked to each other. However, with the exception of rs6503905, which remained strongly associated with plasma MPO levels after taking into account the effect of rs12940923, the association signals with the remaining SNPs were attenuated in the conditional analyses. Of note, rs12940923 is in relatively strong LD (r2 = 0.67) with a −463 G>A promoter polymorphism (rs2333227) in MPO that has previously been associated with plasma MPO levels (42). The association of rs12940923 and rs6503905 with circulating MPO levels is also supported by the directionally consistent and strong cis eQTLs these variants exhibit with MPO expression, even after conditioning on the lead eQTL SNP. Similar cis genetic effects were observed on the expression of other genes at this locus (i.e. RAD51C) as well. Taken together, these data indicate that several SNPs at chromosome 17q22 contribute independently to circulating MPO levels and suggest that this locus may contain a regulatory region(s) with pleiotropic effects on gene expression.
Another interesting observation from our analyses of plasma MPO levels is the suggestive association between circulating MPO levels and variants in the vicinity of GALNT2. For example, an intronic variant (rs2144300) of GALNT2, which we identified in both GWAS and gene-centric analyses for serum MPO levels, has previously been associated with lower HDL levels (43). GALNT2 is involved in protein O-linked glycosylation and, while its role in regulating MPO levels is not immediately evident, it is interesting to note that MPO binds to HDL within atherosclerotic lesions via apolipoprotein A-1 and catalyzes HDL oxidation (44–46), thereby impairing its cardio-protective properties. By comparison, the GWAS for plasma MPO levels identified another SNP (rs12049351) located ∼485 kb proximal to GALNT2 in between ABCB10 and TAF5L that was suggestively associated with plasma MPO levels. Rs12049351 was also associated with serum MPO levels whereas rs2144300 was not associated with plasma MPO levels. These results suggest that specific alleles in this region may control both serum and plasma MPO levels whereas other independent variants are associated with only levels in serum, possibly through a mechanism related to HDL metabolism.
While the results of our analyses have revealed potentially interesting loci that control circulating MPO levels, several limitations of our study should be noted. First, circulating MPO levels could be affected by environmental and/or transient factors, such as physical activity or acute infections, which our analyses did not take into account. Given the apparent effect of serum generation on complement and leukocyte activation, differences in handling and/or processing of blood samples in the various cohorts may have also increased experimental variability and led to additional confounders. Furthermore, GeneBank recruited consecutive patients undergoing elective diagnostic coronary angiography, which would enrich for subjects with CAD, and lead to MPO levels that are on average higher compared with the other population-based studies. This could explain, in part, the variation seen in circulating MPO levels across cohorts even when using the same assay, and the observed heterogeneity in the association results for some of the identified loci. However, these limitations are somewhat mitigated by our use of a sample-weighted Z-score meta-analysis method and the high level of significance obtained from the analyses.
In summary, our comprehensive genetic studies on two ethnicities identified several unique loci that are associated with either serum or plasma MPO levels. These results indicate a potentially prominent role for the complement system in influencing serum MPO levels, presumably via leukocyte activation. By comparison, independent variants at the MPO locus were strongly associated with plasma MPO levels but modestly associated with serum levels. Despite the clinical association of both plasma and serum MPO levels with both prevalent cardiovascular phenotypes and incident risk for major adverse cardiac events, genetic variants associated with circulating MPO levels do not show association with history of CAD in ∼80 000 subjects from the CARDIoGRAM consortium. Additional studies will be needed to gain a better understanding of the functional basis for the association between circulating MPO levels and the identified variants in CFH and MPO, as well as to determine the clinical implications for inflammatory diseases that could be mediated in part through MPO-related activity.
MATERIALS AND METHODS
Study populations
The populations with serum and/or plasma MPO levels used in the present study were the GeneBank, CARDIA, CHS, FHS, MONICA/KORA, GHS and LURIC cohorts. Details of these study populations are provided in the online Supplemental Materials section. The CARe Consortium is a National Heart Lung and Blood Institute supported resource for analyses of the association of genotypes with heart, lung and blood phenotypes (47). All participants in each study provided a written informed consent prior to being enrolled, and the studies were approved by the Institutional Review Boards of the participating institutions.
Circulating measurements
Serum MPO levels were measured in the GeneBank, CARDIA, CHS, FHS and MONICA/KORA cohorts, whereas plasma MPO was measured in the GeneBank, GHS I and GHS II and LURIC studies. The various assays used for these measurements in each cohort are shown in Table 1. The CardioMPO assay is FDA and EU cleared, and appropriate as an in vitro diagnostic test for use in patient care. Serum levels of C3a-desArg, a downstream cleave product of complement activation, were measured using an OptEIA ELISA kit from BD Biosciences (San Diego, CA, USA).
Genome-wide genotyping and imputation
The cohorts included in this meta-analysis of GWAS data used different genotyping platforms: the Affymetrix Human SNP Array 6.0 in the GeneBank, CARDIA, GHS I and II and LURIC2 cohorts; the Affymetrix 500K Array Set for the FHS and LURIC1 cohorts; and the Illumina HumanCNV370-Duo for the CHS cohort. As a standard approach for facilitating meta-analyses, all studies used their genotype data to impute unmeasured, autosomal SNPs using either the CEU data from HapMap (release 22 or 24, build 36) or the 1000 Genomes project. Imputation was performed using either the MACH 1.0.16, Beagle 3.2, or BIMBAM 0.99 programs. Imputation results were filtered at an r2 threshold of 0.5 and a MAF threshold of 0.01. For imputed genotypes, we used dosage information (i.e. a value between 0.0 and 2.0 calculated using the probability of each of the three possible genotypes) in the regression model implemented in PLINK. Details of the genotyping platforms and imputation methods for the GWAS are provided in Table 1 and Supplementary Material, Table S1.
For gene-centric analyses, subjects with serum MPO measurements from the CHS, FHS, CARDIA, and MONICA/KORA cohorts were genotyped using the custom IBCv2 genotyping array that contains high SNP marker density and LD coverage for ∼2100 genes related to cardiovascular, inflammatory, hemostasis/coagulation, and metabolic phenotypes (48). A total of 49 320 SNPs are present on the IBC array, including ∼15 000 SNPs in candidate genes that were not present in HapMap. Additional details regarding SNP selection and the tagging approach that was used have been described previously (48). IBC genotyping was not available in participants from the three cohorts with plasma MPO measurements.
Expression quantitative trait locus (eQTL) analysis
The functional effects of the identified SNPs on gene expression in cis were determined using microarray data from monocytes of 1467 individuals in the GHS I and II cohorts, as described previously (20). Briefly, total RNA was isolated from purified monocytes using RNeasy Mini kits (Qiagen, Hilden, Germany) and hybridized to Illumina HT-12 v3 BeadChips (www.illumina.com). Quality control filtering resulted in 22 305 genes that were considered to be significantly expressed in monocytes and tested for association using the available genotype data. When the numbers of homozygotes for the minor allele of a SNP was <30, they were grouped with heterozygotes. Association of gene expression levels with SNPs was tested using the analysis of variance models (20).
Statistical methods
SNPs were evaluated for association with natural log-transformed circulating MPO levels using linear regression analyses, with adjustment for age and sex. Due to the difficulty of harmonizing MPO assays across cohorts, SNP association results for each ethnic group were combined using an effective sample-weighted Z-score meta-analysis method, as implemented in the software METAL (49), including a test for heterogeneity. Effect estimates within and across all cohorts are expressed as beta coefficients with standard errors. GWAS and gene-centric meta-analyses for serum and plasma MPO levels (from the relevant cohorts) were carried out separately. Differences in serum C3a-desArg levels as a function of genotype were carried out with linear regression using natural log-transformed values.
Associations with coronary artery disease (CAD)
The CAD Genome-wide Replication And Meta-Analysis (CARDIoGRAM) Consortium represents a GWAS meta-analysis of CAD comprising a discovery set of ∼22 000 cases and ∼65 000 controls (50). For each cohort in CARDIoGRAM, logistic regression was first used to test for association with CAD assuming an additive genetic model with adjustment for age and sex and taking into account the uncertainty of possibly imputed genotypes. Subsequently, a meta-analysis was performed separately for every SNP from each study that passed the quality control criteria using a fixed-effects model with inverse variance weighting (50). The results of this default meta-analysis were used to determine whether SNPs affecting circulating MPO levels were also associated with CAD.
FUNDING
The Cleveland Clinic GeneBank study is supported by NHLBI grants P01HL098055, P01HL076491, R01HL103866, P20HL113452 and R01HL103931. The Cardiovascular Health Study (CHS) was supported by NHLBI contracts N01-HC-85239, N01-HC-85079 through N01-HC-85086; N01-HC-35129, N01 HC-15103, N01 HC-55222, N01-HC-75150, N01-HC-45133, HHSN268201200036C and NHLBI grants HL080295, HL087652, HL105756 with additional contribution from NINDS. Additional support was provided through AG-023629, AG-15928, AG-20098, and AG-027058 from the NIA. See also http://www.chs-nhlbi.org/pi.htm. Additional support was provided by R01HL71862. DNA handling and genotyping were supported in part by National Center of Advancing Translational Technologies CTSI grant UL1TR000124 and NIDDK grant DK063491 to the Southern California Diabetes Endocrinology Research Center. [CARe: NHLBI contract HHSN268200960009C]. The Atherosclerosis Risk in Communities Study is carried out as a collaborative study supported by NHLBI contracts N01-HC-55015, N01-HC-55016, N01-HC-55018, N01-HC-55019, N01-HC-55020, N01-HC-55021, N01-HC-55022 and grant HL087641, NHGRI contract U01HG004402 and NIH contract HHSN268200625226C. The Framingham Heart Study is supported by NHLBI contract N01-HC-25195) and Affymetrix, Inc contract N02-HL-6-4278 (for genotyping services), and by grants from NHLBI (HL64753; HL076784), NINDS (NS17950) and NIA (AG08122, AG16495, AG028321. The CARDIA study is supported by NHLBI contracts NO1-HC-48047, NO1-HC-48048, NO1-HC-48049, NO1-HC-48050 and NO1-HC-95095. Genotyping and statistical analyses of the CARDIA white participants were supported by grants U01-HG-004729, U01-HG-004446 and U01-HG-004424 from the National Human Genome Research Institute. H.A. was supported by R01ES021801 from NIEHS. The MONICA/KORA Augsburg studies were financed by the Helmholtz Zentrum München, German Research Center for Environmental Health, Neuherberg, Germany and supported by grants from the German Federal Ministry of Education and Research (BMBF). Part of this work was financed by the German National Genome Research Network (NGFNPlus, project number 01GS0834) and through additional funds from the University of Ulm. Furthermore, the research was supported within the Munich Center of Health Sciences (MC Health) as part of the Ludwig Maximilians University (LMU) innovative. The Gutenberg Health study (GHS) is funded through the government of Rheinland-Pflaz (No. AZ 961-386261/733), the research program ‘Wissen schafft Zuknunft’ and the ‘Schwerpunkt Vaskuläre Prävention’ of the Johannes Gutenberg University of Mainz and its contract with Boehringer Ingelheim and PHILIPS medical systems, including an unrestricted grant for the GHS. This project has also been supported by the National Genome Network ‘NGFNplus’ by the Federal Ministry of Education and Research, Germany (No. 01GS0833 and 01GS0831, projects A3/D1), and by joint funding from the Agence Nationale de la Recherche, France (contract ANR 09 GENO 106 01) and from the Federal Ministry of Education and Research, Germany. LURIC has received funding from the European Community's Seventh Framework Programme (FP7/2007-2013) under grant agreement No. 201668; AtheroRemo.
ACKNOWLEDGEMENTS
See the online-only Data Supplement.
Conflict of Interest statement. Dr Hazen (SLH) is named as a co-inventor on pending and issued patents held by the Cleveland Clinic relating to cardiovascular diagnostics. Dr Hazen reports that he has been working as a consultant or speaker for the following companies: Cleveland Heart Lab, Inc., Esperion, Liposciences Inc., Merck & Co., Inc. and Pfizer Inc. He reports that he has received research funds from Abbott, Cleveland Heart Lab, Esperion and Liposciences, Inc. He has the right to receive royalty payments for inventions or discoveries related to cardiovascular diagnostics from Abbott Laboratories, Cleveland Heart Lab, Inc., Frantz Biomarkers, LLC and Siemens.
REFERENCES
Author notes
These authors contributed equally to this work.
A full list of authors and affiliations for the CARDIoGRAM Consortium is provided in the Supplementary Data.
