


Abstract
HLA-G is a class Ib HLA gene with unique tissue expression pattern and immunomodulatory properties. Polymorphisms in the HLA-G promoter region have been associated with miscarriage and asthma, whereas expression levels have been associated with a wide range of pathologic conditions as well as survival of embryos after in vitro fertilization and of organs after transplantation. Here, we characterize the sequence variation and haplotype structure of the HLA-G promoter and flanking sequences in 44 African Americans, 47 European Americans and 43 Han Chinese by haplotype-specific PCR and sequencing. In all three populations, we observed high levels of nucleotide variation, an excess of intermediate-frequency alleles, and a genealogy with two common haplotypes separated by deep branches, features that are suggestive of balancing selection acting in this region. Comparisons to HLA-A and a pseudogene, HLA-J, suggested that the observed pattern of sequence variation in the HLA-G promoter region is not likely due to other selected HLA genes. We suggest that the mechanism for this selection is related to the highly regulated expression pattern of HLA-G and that high- and low-expressing promoters may be favored under temporally and/or spatially varying selective pressures.
INTRODUCTION
The class I HLA genes are located at the telomeric end of the HLA complex on chromosome 6p21 and include both class Ia, HLA-A, -B and -C, and class Ib, HLA-E, -F and -G, genes (Fig. 1). The HLA class Ia and Ib genes differ with respect to polymorphism levels, tissue distribution and function. For example, the class Ia genes are among the most polymorphic human genes, whereas the class Ib have few (if any) variants (1). Expression of class Ia antigens is ubiquitous, whereas class Ib antigen expression is tissue/organ specific and/or conditional (HLA-F and -G) or dependent on expression of other class I genes (HLA-E). The primary function of the class Ia genes is antigen presentation (1), whereas the class Ib genes also serve novel functions, all of which are still unclear (2). HLA-G is additionally unique among class I genes because it undergoes alternative splicing. Seven alternatively spliced transcripts have been identified, four are predicted to encode membrane-bound proteins and three are predicted to encode soluble proteins. At least four of these splice forms (two membrane-bound and two soluble) are expressed as protein in fetal cells at the maternal–fetal interface, as demonstrated by immunohistochemistry (3–5).
Moreover, because of its primary site of expression at the maternal–fetal interface, its limited polymorphism in the coding region and its ability to inhibit NK and T cells, HLA-G is thought to contribute to maternal tolerance of the allogeneic fetus (6–9). In fact, HLA-G alleles and mRNA and protein expression levels have been associated with pre-eclampsia, miscarriage and pregnancy success rates following in vitro fertilization (IVF), suggesting a crucial role for HLA-G in pregnancy (7,9). The immmuno-supressive functions of HLA-G have also been related to other clinical conditions. HLA-G expression was correlated with a decreased number of acute and chronic rejection episodes following heart transplantation (10) and acute rejection following combined liver–kidney transplantation (11). Viruses and tumors may up-regulate HLA-G to escape host immune attack (7,12), and HLA-G expression has been associated with asthma and bronchial hyper-responsiveness (13,14) and other pulmonary diseases (15), ulcerative colitis (16), psoriasis (17) and multiple sclerosis (18).
These combined observations suggest that the immunomodulatory properties of HLA-G may be important in immune-mediated conditions and that its expression is under tight regulation. In addition, the fact that high levels of expression appear to protect allogeneic tissues in pregnancy (and transplantation) but might contribute to pathogenicity in adult immune-mediated diseases further suggests that there might be a fine balance between optimal levels of expression from fetal to adult life. Not surprisingly, therefore, the 5′-upstream regulatory region of HLA-G, which includes all of the known promoter elements, is unique among the classical HLA genes (19). In particular, the response of the HLA-G promoter to a number of transcription factors differs both qualitatively and quantitatively from all other class I loci (20,21).
We recently characterized the sequence variation and haplotype structure of the HLA-G promoter region in a founder population with a restricted number of HLA haplotypes (22,23). In contrast to the modest level of variation in the coding region, the promoter of HLA-G was extraordinarily polymorphic, with 18 SNPs identified in the region approximately 1500 bp upstream of exon 1 (22,24). Most variants were quite common, and for some, the common allele was the derived allele on the basis of the chimpanzee sequence. These unusual features, combined with the associations with miscarriage (22) and asthma (13), led us to further investigate the evolutionary history of the HLA-G promoter. Here, we present evidence for selection maintaining two divergent lineages of promoter haplotypes in diverse human populations, consistent with a history of balancing selection.
RESULTS
Sequence variation, frequency spectrum and genetic differentiation of HLA-G promoter
We identified 27 SNPs and 13 haplotypes in the HLA-G promoter region in the African American (AA), European American (EA) and Chinese (CN) populations, using haplotype-specific PCR followed by direct sequencing (Fig. 2, Fig. 3). All of the haplotypes identified in Ober et al. except the G*010103-associated haplotype described in that earlier report (Materials and Methods) were present in these samples. In addition, nine SNPs and seven haplotypes identified here were not found in the previous study. Two haplotypes were present only in the AA sample (G*010301c and G*010301d), one haplotype was present only in the EA sample (G*010102b) and two haplotypes were present only in the CN sample (G*010101e and G*010401b). Lastly, one additional rare haplotype and a third allele (T) at position −725 was present in the Hutterites (G*010301b), but was missed in the earlier study (22). We include here for completeness an additional haplotype (G*010102c), defined by the presence of an A at −922, which was identified in two EA individuals with asthma but not in any of the 134 individuals included in the present study. This haplotype was not included in any of the analyses reported subsequently, except where noted.
Nucleotide diversity (π_it;) in the AA (0.0064), EA (0.0059) and CN (0.0059) samples was about eight times as high as the human genome average (0.00075) (25). Human–chimpanzee divergence at the HLA-G promoter is 1.4%, which is close to the average genome divergence of 1.24% (26), indicating that the mutation rate at the HLA-G promoter region is not unusual.
Under neutral evolution, polymorphism level is proportional to divergence level. An unusual ratio of diversity to divergence is suggestive of natural selection. We compared the ratio of nucleotide diversity to divergence (with chimpanzee as the outgroup) in the AA and EA samples to 132 human genes from the Seattle SNP database (27) (Fig. 4). Strikingly large values were obtained for HLA-G in the AA (0.50) and EA (0.46) samples that were almost twice as high as the largest values in the Seattle SNP genes in the two populations, reflecting the very high polymorphism level at this region.
We next examined the allele frequency distribution using Tajima's D-test to detect the signature of selection. This test is based on the fact that two measures of polymorphism, π_it; and 𝛉_it;W, are affected differently by selection and population history (28). Both balancing selection and population subdivision tend to produce an excess of old, intermediate-frequency variants. In these cases, π_it; will be higher than 𝛉_it;W and Tajima's D will be positive. In contrast, positive selection and population expansion will result in an excess of young, low frequency variants and Tajima's D will be negative. Under neutrality and population equilibrium, Tajima's D will be 0. At the HLA-G promoter, Tajima's D was high in all three populations: 2.56 in the AA (P<0.05), 1.80 in the EA (P<0.10) and 1.87 in the CN (P<0.10) samples. Because Tajima's test of significance assumes a constant population size, which is not a realistic assumption for human populations, we compared HLA-G with the empirical distribution of Tajima's D based on 232 human genes included in the Seattle SNP database to test for significance. In the AA samples, Tajima's D for HLA-G is higher than those of all the other genes; in the EA samples, Tajima's D for HLA-G is among the top 5% of the highest values, reflecting the excess of alleles at intermediate frequencies (>10%) at the HLA-G promoter region. The fact that Tajima's D was highly positive in three populations with different histories makes it unlikely that these results are due to demography. Rather, they suggest that balancing selection has influenced the patterning of variation in the HLA-G promoter region.
Fu and Li's D and F are additional tests of neutrality based on the frequency spectrum (29). Negative values of Fu and Li's D and F reflect an excess of young mutations, and positive values correspond to an excess of old mutations. Here, we used the orangutan as an outgroup because the greater divergence time results in more fixed differences between the two species (compared with chimp) and greater power to detect selection. Fu and Li's D and F were positive in the AA and EA samples and negative in the CN sample (Table 1). Both statistics were significant in the AA samples, but only the F-statistic reached statistical significance in the EA and CN samples (P<0.05). The negative values in the CN sample are due to the presence of proportionally more singletons (particularly those on the G*010301a promoter haplotype) in the CN sample and the greater sensitivity of this test to singletons than Tajima's D. Thus, Fu and Li's D statistics also suggest that the pattern of variation at the HLA-G promoter region shows significant departures from neutral expectations.
Population genetic differentiation, quantified by FST, can also be used to detect the signature of natural selection. Geographically restricted directional selection may increase FST, whereas balancing or species-wide directional selection may cause a decrease in FST (30,31). FST among the three populations is 0.0028, much lower than the genome average of 0.123 among AAs, EAs and East Asians (30) and not significantly different from 0. This indicates that genetic differentiation at HLA-G promoter is extremely low and suggests a similar evolutionary history at this locus on the three major continents.
Haplotype structure and haplotype numbers of HLA-G promoter
The haplotype structure at the human HLA-G promoter, visualized by network, also supports a history of balancing selection at this region. The haplotype network patterns are overall quite similar in all three populations, in which the haplotypes are separated by long branch lengths into two clades (Fig. 5), corresponding to their genotypes at −1306 and +15 (Fig. 3). Each clade contains one common haplotype, G*010101a and 010102a, respectively, consistent with long-standing balancing selection preserving two lineages.
Comparisons to a pseudogene HLA-J
The observed pattern of sequence variation in the HLA-G promoter region could be due to natural selection acting on the gene itself or due to neighboring HLA genes that are under strong balancing selection (32). For example, the pseudogene HLA-H, which is located less than 100 kb away from HLA-G (Fig. 1), has increased polymorphism levels due to genetic hitchhiking (33). To determine whether the pattern of variation that we observed in the HLA-G promoter region could be due to selection at the HLA-A locus, we sequenced the ‘promoter’ region of a pseudogene, HLA-J, in the same individuals from the three populations. HLA-J is 50 kb centrometric to HLA-A (Fig. 1) and probably shared a common ancestor with HLA-G (34). Both nucleotide diversity/divergence and Tajima's D at this region are higher than the genome averages when compared with the Seattle SNP data (Table 1 and Fig. 4), reflecting high background variation in the HLA region because of the presence of selected genes (33). However, they are still much lower than those observed for HLA-G. Interestingly, FST at HLA-J promoter is also very low (0.033) (Table 1).
We next compared the sequences at the HLA-G and HLA-J loci, using the HKA test, again with the orangutan as the outgroup (35). This test compares within-species polymorphism to between-species divergence of two loci. Under neutral evolution, polymorphism level within species is proportional to divergence level between species, both reflecting the mutation rate. If the relative polymorphism to divergence is different between a neutral locus and another locus, it is suggestive of the action of natural selection on the latter locus. Although the HKA tests between HLA-G and HLA-J are not significant (Table 2), in all three populations, HLA-G has more polymorphisms relative to divergence than HLA-J. This is consistent with the expectation for balancing selection, in which mutations accumulate on allelic lineages maintained by selection and increase the within-species polymorphism level. These results also further suggest that this region has had similar evolutionary histories in the three populations studied.
Phylogenetic trees of HLA-A and HLA-G
In addition to comparing HLA-G to the pseudogene HLA-J, we also wanted to directly evaluate the possible influence of HLA-A on HLA-G. We used the HLA-A phylogenetic tree reported by Gu and Nei (36), which divides the HLA-A alleles into five clades, A-I to A-V, and constructed a phylogenetic tree for HLA-G, using the same method (Fig. 6). Consistent with the network tree (Fig. 5), the HLA-G phylogenetic tree also has two long branches representing the ‘G-G’ and the ‘A-A’ clades. We then used the previously reported HLA haplotype data in the Hutterites (23), which included HLA-A and HLA-G, to calculate the proportion of ‘G-G’ haplotypes and ‘A-A’ haplotypes that are in linkage with HLA-A alleles within each of the five HLA-A clades. The Hutterite HLA haplotypes and alleles are similar to those observed in the outbred Caucasians, although there are fewer of both present in this isolated population (Weitkamp and Ober). If the generation of the two deep branches of the HLA-G tree was due to the linkage disequilibrium between HLA-A and HLA-G, we would expect the HLA-G ‘G-G’ and ‘A-A’ clades to cluster within separate HLA-A clades. Contrary to this expectation, the HLA-G ‘G-G’ haplotypes are associated with four very divergent HLA-A clades and the ‘A-A’ haplotypes are associated with all five HLA-A clades. Therefore, balancing selection at the HLA-A locus was not likely to generate the pattern of diversity present at the HLA-G locus.
Population genetics analysis of chimpanzee MHC-G promoter
Because balancing selection favors more than one allele at a locus, none of the selected alleles will go to extinction or reach fixation. Therefore, balancing selection can maintain old mutations in the mutations. Sometimes, these mutations are sufficiently old to be shared among different species. These so-called ‘trans-species polymorphisms’ are common at HLA loci. For example, phylogenetic tree analyses show that some human HLA-DQB1 alleles are more similar to chimpanzee Patr-DQB1 alleles than to other human alleles (37). These clustering patterns of alleles suggest that they arose before the human and chimpanzee divergence.
To examine this possibility for HLA-G promoter haplotypes, we sequenced the MHC-G promoter region in 15 western chimpanzees (Pan troglodytes verus). None of the 27 sites that were polymorphic in humans was polymorphic in the western chimpanzees, suggesting that these polymorphisms are human specific and originated after human–chimpanzee speciation. We also analyzed the sequence variation pattern of the Patr-G promoter in the western chimpanzees. Unlike HLA-G, the Patr-G promoter sequence has little nucleotide diversity (0.00071) and a negative Tajima's D (−0.72) (Table 1), suggesting a different evolutionary history of this gene in western chimpanzees and in humans.
DISCUSSION
The best known examples of diversifying selection in the human genome are at the class Ia and class II HLA genes, which are characterized by extraordinary levels of polymorphisms in the amino acids that form the peptide-binding pocket (38). This selection is presumably driven by the antigen presenting function of MHC molecules, with either heterozygote advantage or frequency-dependent selection, or both, maintaining the unique genetic features of these genes (1,39). Balancing selection acting on the promoter of a class Ib HLA gene, or any HLA gene, has never been reported before.
The HLA-G promoter is unique among the HLA genes (19). Several of the cis-regulatory elements conserved in all other HLA genes are disrupted or deleted in HLA-G. For example, enhancer A, the SXY module and the interferon-stimulated regulatory element (ISRE) have acquired mutations that make them non-functional. As a result, HLA-G does not respond to NF-κB and class II trans-activator (CIITA) and is less responsive to IFN-γ when compared with the other HLA genes. Moreover, whereas all known regulatory elements are contained within approximately 500 bp upstream of exon 1, the known HLA-G regulatory elements extend to nearly 1500 bp upstream of exon 1. Functional elements in this upstream region, such as a heat-shock element (40), an ISRE (41) and a tissue (trophoblast)-specific regulatory element (also referred to as ‘locus control region’) (42,43), likely regulate the expression pattern of this gene. Many of the polymorphisms in the 5′-upstream region either coincide with or are close to these regulatory elements (22). Thus, the evidence for balancing selection in the promoter region of HLA-G may be related to its unique expression pattern.
The studies reported here suggest that selection has maintained two allelic lineages at the HLA-G locus. It is tempting to speculate that these two allelic lineages may have different promoter activities. These differences could result in different spatio-temporal expression patterns that meet different immunologic needs and be tissue and/or development stage-specific. In particular, the competing needs of the feto-placental unit to inactivate maternal immune cells to ensure its survival, at the same time to maintain a sufficient number of immune competent maternal cells in the uterus to ward off infection, may have required a fine balance between high-expressing and low-expressing HLA-G haplotypes. During pregnancy, high-expressing haplotypes might be favored in the absence of infection, whereas low-expressing haplotypes might be favored in the presence of infection. Selection for high-expressing haplotypes in some circumstances is supported by observations of greater implantation rates after IVF of embryos that express HLA-G when compared with embryos that do not (44–46) and increased fetal loss rates among couples with recurrent miscarriage, who carry a null allele for the HLA-G1 and -G5 isoforms (47,48). In contrast, the high frequency of the null allele, called G*0105 N, in African populations and populations of African descent and the evidence for positive selection acting on this null allele raised the possibility that under some circumstances, reduced levels of HLA-G might be advantageous (47). Given the distribution of the null allele among populations with high pathogen load, we previously suggested that reduced expression levels of HLA-G might allow for a more robust maternal immune response against invading pathogens during pregnancy (47). Thus, among populations in environments with a high pathogen load, low-expressing haplotypes might be advantageous.
The recent discovery of the expression of HLA-G in adult cells, particularly in the presence of immune-mediated diseases (13,14,16,17), suggests other possible selection scenarios at this locus. At the maternal–fetal interface, the expression of HLA-G contributes to the skew toward Th2 cytokine-producing T cells in pregnancy (49–51). If HLA-G serves a similar function in the periphery, its expression might enhance the Th2 response against parasitic infections, but inhibit the important Th1 response against viral infections. This hypothesis is supported by recent reports of increased survival of transplanted tissues that express HLA-G because of decreased T cell-mediated cytotoxicity and of HLA-G expression in two Th2-associated diseases, asthma (13,14) and ulcerative colitis (16). Moreover, the fact that HLA-G can be up-regulated in peripheral cells by class I and class II interferons suggests that it could have unwarranted immunosuppressive effects in the presence of viral infections. Thus, it is possible that the need for both high-expressing and low-expressing HLA-G promoters in response to infection post-natally also contributes to the maintenance of two families of haplotypes at this locus.
Additionally, balancing selection of the HLA-G promoter region may be related to the different functions of HLA-G isoforms. Promoter activity can influence alternative splicing (52), making it possible that the different promoter sequences or activity levels influence the relative abundance of the different HLA-G isoforms. Perturbations of the relative abundance of alternatively spliced transcripts have been associated with pre-eclampsia (53,54), and there is tight regulation of the expression of the HLA-G isoforms in placental cells (3). However, because the functions of HLA-G and the mechanisms of its regulation are still largely unknown, more work is needed to elucidate the mechanism(s) underlying the balancing selection acting at this locus.
In conclusion, we observed strong evidence of balancing selection at the HLA-G promoter. In three major human populations, there are extraordinarily high levels of nucleotide variation. Population genetic statistics indicate a significant excess of intermediate frequency alleles, more polymorphism relative to divergence, negligible differentiation between populations representing three major continents and a genealogy with two deep clades. We ruled out another HLA locus as an explanation for these features and suggest that the genetic characteristics of the HLA-G promoter are consistent with an old balanced polymorphism maintaining two divergent promoter sequences in the human species.
MATERIALS AND METHODS
DNA samples
We included in these studies DNA from 44 AAs and 47 EAs who participated as controls in our studies of asthma in Chicago (55,56) and 43 Han Chinese from the International Hapmap Project (HAPMAPPT02 plate). The Chicago controls identified themselves as having at least three grandparents of either European ancestry or of AA ancestry. We also included DNA from one orangutan, one chimpanzee and one gorilla, used previously in our laboratory (33), and 15 western chimpanzees (Pan troglodytes verus) from Coriell Cell Repositories, repository numbers: NA03448, NA03450, NG06939, NG03489, NS03612, NS03622, NS03623, NS03639, NS03641, NS03646, NS03650, NS03656, NS03657, NS03659 and NS03660.
PCR and sequencing
Haplotype-specific PCR was used to amplify the promoter region of HLA-G. On the basis of a previous study in the Hutterites (22), HLA-G promoter haplotypes were divided into two groups. One group of haplotypes had a G at position −1306 at the distal end of the promoter and a G at position +15 in exon 1 (referred to as G-G haplotypes). All other haplotypes had an A at −1306 and an A at +15 (referred to as A-A haplotypes). We selected these two SNPs for a haplotype-specific PCR that amplifies the segment that included all the known regulatory element. Because we had not observed an A-G or G-A haplotype in any human samples, we used a chimpanzee sample as an A-G control and created by site-directed mutagenesis an artificial haplotype with a G at position −1306 and an A at position +15. All numbering is relative to the translation initiation site (ATG) in exon 1; the transcription start site begins at −20 (unpublished data).
We used two forward primers with the 3′ ends corresponding to −1306G and −1306A, and two reverse primers with the 3′ ends complementary to +15G and +15A. The primer sequences are: HLA-GAS-FW-G: aacagtgctagagccacag; HLA-GAS-RE-G: gaagagggttcggggc; HLA-GAS-FW-A: aacagtgctagagccacaa; HLA-GAS-RE-A: gaagagggttcggggt. The four combinations of primer pairs were used to amplify each sample, to identify four possible haplotype groups (Fig. 2). For samples that amplified with only one set of primers (either A-A or G-G) but had more than one heterozygous site in the sequence, we deduced their haplotypes using previously reported haplotypes (22) and haplotypes identified as part of these studies. Primers HLA-J-fw: ccttaagtgggtctgcttaaaaa and HLA-J-re: gtggacctttcgctcct were used to amplify −1122 to +128 (relative to the ‘translation’ start site) of the HLA-J pseudogene.
We sequenced exons 2, 3 and 4 in each human sample to determine the HLA-G allele and inferred associations of each allele with the promoter haplotypes from our previous studies (22). We named the promoter haplotype using the name of the HLA-G allele that was associated with each haplotype (such as G*010101, G*010401, etc.) and lettered consecutively (a, b, c, etc.) if there were more than one promoter haplotype associated with a particular HLA-G allele. If the same promoter haplotype was associated with more than one HLA-G allele, we used the name of the most common allele in that group. As in our previous report (22), the G*010101, G*010104, and G*010108 alleles had identical promoter sequences (all referred to as G*010101a here) and the G*010102a, G*010105 N and G*010106 alleles had identical promoters (all referred to as G*010102a here). However, since our previous report, we determined that the G*010103 promoter is also identical to the G*010102 group of promoters and include it within that group in this report.
PCR products were sequenced on a 3100 DNA sequencer (Applied Biosystems).
Data analysis
DNA polymorphisms were identified using Polyphred (57). Population genetic tests were performed using Dnasp (version 4.00.4) (58). Haplotype networks were constructed by using the median joining algorithm of the program Network 4.1.0.9 (http://www.fluxus-engineering.com) (59). A HLA-G phylogenetic tree was constructed by the neighbor-joining method (60), with the distance matrix computed by Kimura's two-parameter method (61) as implemented in the MEGA3 program (62). Sequence data for 24 AAs and 23 EAs, available from the Seattle SNP database (http://pga.gs.washington.edu), were used to generate empirical distributions of nucleotide diversity (π_it;)/human–chimpanzee divergence (132 genes) and Tajima's D (232 genes) in each sample. The AA samples in the Seattle SNP data set were obtained from the African-American Panel (HD50AA) of the Human Variation Panel from the Coriell Institute; the EA samples were unrelated individuals from CEPH pedigrees. Similar to the Chicago samples used in this study, the Seattle SNP samples were assigned to racial groups by self-identification and likely belong to similar broadly defined pools of individuals. Furthermore, because the chimpanzee sequence was included in the Seattle SNP database, we used the chimpanzee as the outgroup for all comparisons between our data and the Seattle SNP data.
ACKNOWLEDGEMENTS
The authors gratefully acknowledge Anna Di Rienzo and Molly Przeworski for helpful comments and discussion, Deborah Nickerson and Joshua Akey for providing Seattle SNP sequence data and Katinka Vigh and Jeffrey Goodenbour for technical assistance. This work was supported partly by NIH grants HD21244 and HL72414 to C.O. and MOI RR00055 to The University of Chicago General Clinical Research Center.
Conflicts of Interest statement. None declared.
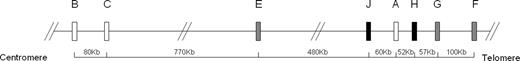
Figure 1. Class I HLA genes. Class Ia HLA genes (open boxes), class Ib HLA genes (solid gray boxes) and pseudogenes (solid black boxes) are shown. Distances between genes, calculated according to UCSC human genome database (http://genome.ucsc.edu/cgi-bin/hgGateway), are shown on the horizontal bars.
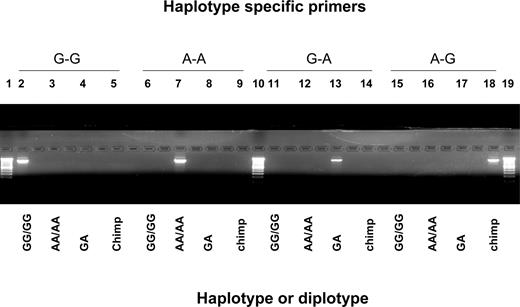
Figure 2. Haplotype-specific PCR of HLA-G promoter. Chimpanzee DNA was used as a positive control for the A-G haplotype; the G-A haplotype was artificially constructed by site-directed mutagenesis (see Materials and Methods for details).
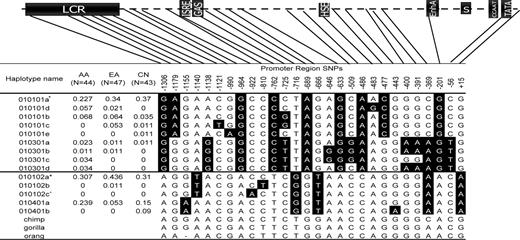
Figure 3. HLA-G promoter polymorphisms and haplotypes. CN, Han Chinese. The haplotypes can be divided into two clades defined by either −1306G/+15G or −1306A/+15A. Alleles shown as black letters on a white background correspond to the chimp sequence and are presumed to be ancestral; alleles shown as white letters on a black background are presumed to be derived alleles, as in Ober et al. TATA, TATA box; CCAAT, CAAT box; S/X1, Pan HLA regulatory elements; ISRE, interferon-specific regulatory element; EnhA, enhancer A; HSE, heat-shock protein element; GAS, gamma (interferon) activated site; LCR, locus control region. Note: (+) G*010101a includes the 010101, 010108 and 010104 HLA-G alleles; (asterisk) G*10102a includes the 010102, 010103, 0105 N and 010601 HLA-G alleles; (caret) G*010102c was present in asthma patients only.
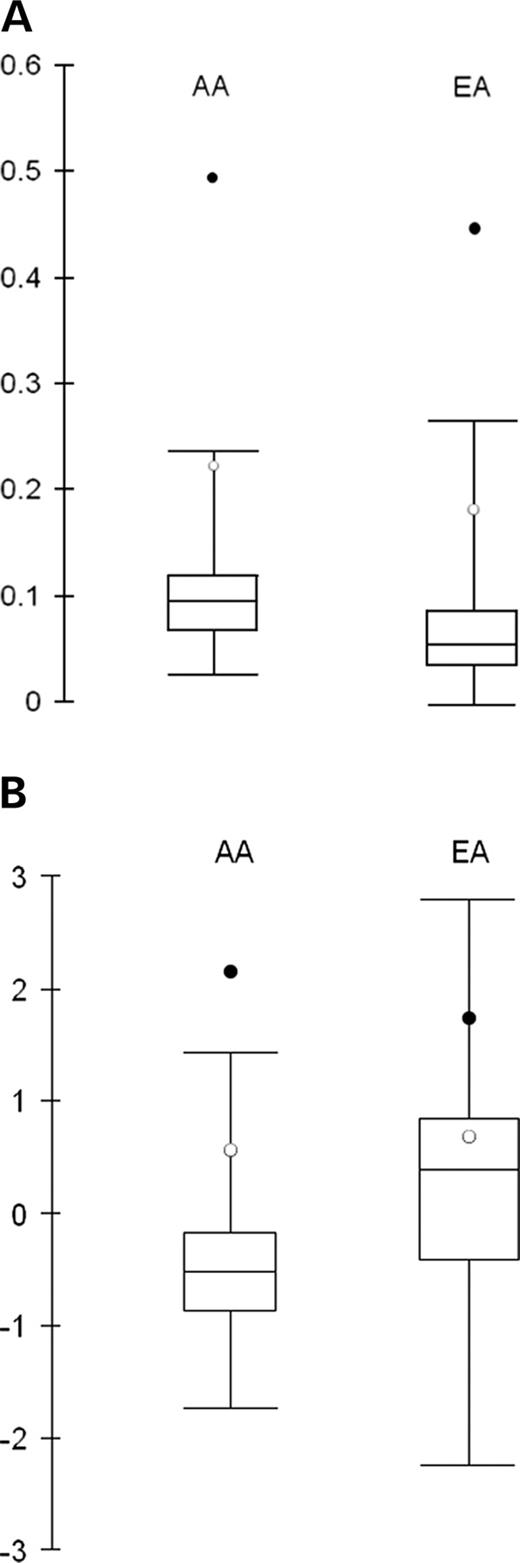
Figure 4. Comparison of HLA-G and HLA-J with the Seattle SNP genes in the AA and EA. Values of HLA-G (closed circles) and HLA-J (open circles) are shown; the distributions of the Seattle data are shown by box plots. (A) Ratio of nucleotide diversity (π_it;) to human–chimpanzee divergence using 132 Seattle SNP genes. (B) Tajima's D using 232 Seattle SNP genes.
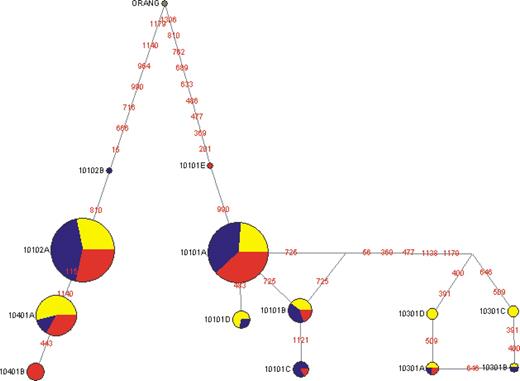
Figure 5. Evolutionary relationship of HLA-G promoter haplotypes by reduced median network analysis. The G*010102c haplotype, which was only present in asthma patients, is included in this analysis. Each circle represents a different haplotype, with the size of the circle proportional to the frequency of the haplotype in the AAs (yellow), EAs (blue) and Han Chinese (red). Nucleotide differences between haplotypes are indicated on the branches of the network. The arrow shows where the orangutan haplotype joins the network.
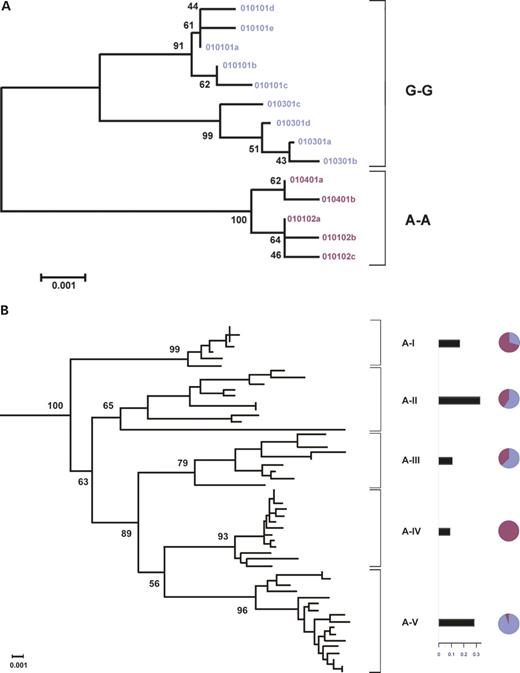
Figure 6. Phylogenetic trees of HLA-A and HLA-G. (A) Phylogenetic tree of HLA-G. The ‘G-G’ haplotypes are shown in blue and the ‘A-A’ haplotypes are shown in red. (B) The HLA-A phylogeny was divided into five clades (A-I to A-V), modified from Gu and Nei (36). The horizontal bars show the frequencies of the different HLA-A clades in the Hutterites in whom the following alleles are present: A24 (clade A-I); A1, A3, A11, A30 (clade A-II); A31, A32, A33 (clade A-III); A26, A34 (clade A-IV); and A2 (clade A-V). The pie diagrams on the right indicate the proportions of the HLA-G ‘G-G’ haplotypes (blue) and ‘A-A’ haplotypes (red) that are on the same haplotype with the HLA-A alleles in each of the five clades in the Hutterites.
Summary statistics of sequenced regions
| Region | Population | Sequencelength | Number ofsegregatingsites | π_it; | 𝛉_it;w | Nucleotidediversity/divergence | Tajima's D | Fu andLi D | Fu andLi's F | FST |
|---|---|---|---|---|---|---|---|---|---|---|
| HLA-G promoter | AA | 1320 | 23 | 0.0064 | 0.0034 | 0.50* | 2.56* | 1.81** | 2.52** | 0.0028 |
| EA | 25 | 0.0059 | 0.0039 | 0.46* | 1.80** | 1.44*** | 1.98** | |||
| CN | 24 | 0.0059 | 0.0038 | 0.49 | 1.87 | −1.24 | −0.05 | |||
| HLA-J promoter | AA | 1113 | 11 | 0.0024 | 0.002 | 0.20** | 0.56*** | 0.79 | 0.84 | 0.033 |
| EA | 13 | 0.0029 | 0.0023 | 0.22** | 0.66 | 1.51*** | 1.42 | |||
| CN | 12 | 0.0026 | 0.0021 | 0.20 | 0.57 | 1.51*** | 1.40 | |||
| Chimp MHC-G promoter | 1320 | 5 | 0.00071 | 0.00097 | n.p. | −0.72 | −0.61 | −0.75 | n.p. |
The significance of nucleotide diversity/divergence and Tajima's D is based on the empirical distribution of the Seattle SNP data in the AAs and EAs and the significance of the Chinese data is not assessed. Significance of Fu and Li's D and F is from Dnasp. n.p., test not performed.
*P<0.01.
**P<0.05.
***P<0.10.
HKA tests of HLA-G versus HLA-J, orangutan was used as the outgroup
| AA | EA | CN | ||||
|---|---|---|---|---|---|---|
| HLA-G | HLA-J | HLA-G | HLA-J | HLA-G | HLA-J | |
| Within-species polymorphisms | 23 | 11 | 25 | 13 | 24 | 12 |
| Between-species divergence | 52.5 | 63.2 | 52.7 | 64.6 | 51.7 | 64.6 |
| P-value | 0.11 | 0.13 | 0.11 | |||
| AA | EA | CN | ||||
|---|---|---|---|---|---|---|
| HLA-G | HLA-J | HLA-G | HLA-J | HLA-G | HLA-J | |
| Within-species polymorphisms | 23 | 11 | 25 | 13 | 24 | 12 |
| Between-species divergence | 52.5 | 63.2 | 52.7 | 64.6 | 51.7 | 64.6 |
| P-value | 0.11 | 0.13 | 0.11 | |||
References
Meyer, D. and Thomson, G. (
O'Callaghan, C.A. and Bell, J.I. (
Morales, P.J., Pace, J.L., Platt, J.S., Phillips, T.A., Morgan, K., Fazleabas, A.T. and Hunt, J.S. (
Ishitani, A. and Geraghty, D.E. (
Fujii, T., Ishitani, A. and Geraghty, D.E. (
LeMaoult, J., Le Discorde, M., Rouas-Freiss, N., Moreau, P., Menier, C., McCluskey, J. and Carosella, E.D. (
Le Bouteiller, P., Legrand-Abravanel, F. and Solier, C. (
Hunt, J.S., Petroff, M.G., McIntire, R.H. and Ober, C. (
Lila, N., Carpentier, A., Amrein, C., Khalil-Daher, I., Dausset, J. and Carosella, E.D. (
Creput, C., Le Friec, G., Bahri, R., Amiot, L., Charpentier, B., Carosella, E., Rouas-Freiss, N. and Durrbach, A. (
Wiendl, H., Mitsdoerffer, M., Hofmeister, V., Wischhusen, J., Bornemann, A., Meyermann, R., Weiss, E.H., Melms, A. and Weller, M. (
Nicolae, D., Cox, N.J., Lester, L.A., Schneider, D., Tan, Z., Billstrand, C., Kuldanek, S., Donfack, J., Kogut, P., Patel, N.M. et al. (
Rizzo, R., Mapp, C.E., Melchiorri, L., Maestrelli, P., Visentin, A., Ferretti, S., Bononi, I., Miotto, D. and Baricordi, O.R. (
Pangault, C., Le Friec, G., Caulet-Maugendre, S., Lena, H., Amiot, L., Guilloux, V., Onno, M. and Fauchet, R. (
Torres, M.I., Le Discorde, M., Lorite, P., Rios, A., Gassull, M.A., Gil, A., Maldonado, J., Dausset, J. and Carosella, E.D. (
Aractingi, S., Briand, N., Le Danff, C., Viguier, M., Bachelez, H., Michel, L., Dubertret, L. and Carosella, E.D. (
Mitsdoerffer, M., Schreiner, B., Kieseier, B.C., Neuhaus, O., Dichgans, J., Hartung, H.P., Weller, M. and Wiendl, H. (
Solier, C., Mallet, V., Lenfant, F., Bertrand, A., Huchenq, A. and Le Bouteiller, P. (
Gobin, S.J., Keijsers, V., van Zutphen, M. and van den Elsen, P.J. (
Gobin, S.J. and van den Elsen, P.J. (
Ober, C., Aldrich, C.L., Chervoneva, I., Billstrand, C., Rahimov, F., Gray, H.L. and Hyslop, T. (
Weitkamp, L.R. and Ober, C. (
Hviid, T.V., Sorensen, S. and Morling, N. (
Sachidanandam, R., Weissman, D., Schmidt, S.C., Kakol, J.M., Stein, L.D., Marth, G., Sherry, S., Mullikin, J.C., Mortimore, B.J., Willey, D.L. et al. (
Ebersberger, I., Metzler, D., Schwarz, C. and Paabo, S. (
Akey, J.M., Eberle, M.A., Rieder, M.J., Carlson, C.S., Shriver, M.D., Nickerson, D.A. and Kruglyak, L. (
Tajima, F. (
Fu, Y.X. and Li, W.H. (
Akey, J.M., Zhang, G., Zhang, K., Jin, L. and Shriver, M.D. (
Bowcock, A.M., Kidd, J.R., Mountain, J.L., Hebert, J.M., Carotenuto, L., Kidd, K.K. and Cavalli-Sforza, L.L. (
Grimsley, C., Mather, K.A. and Ober, C. (
Messer, G., Zemmour, J., Orr, H.T., Parham, P., Weiss, E.H. and Girdlestone, J. (
Hudson, R.R., Kreitman, M. and Aguade, M. (
Gu, X. and Nei, M. (
Hughes, A.L. and Yeager, M. (
Hughes, A.L. and Nei, M. (
Takahata, N. and Nei, M. (
Ibrahim, E.C., Morange, M., Dausset, J., Carosella, E.D. and Paul, P. (
Lefebvre, S., Berrih-Aknin, S., Adrian, F., Moreau, P., Poea, S., Gourand, L., Dausset, J., Carosella, E.D. and Paul, P. (
Schmidt, C.M., Chen, H.L., Chiu, I., Ehlenfeldt, R.G., Hunt, J.S. and Orr, H.T. (
Moreau, P., Paul, P., Gourand, L., Prost, S., Dausset, J., Carosella, E. and Kirszenbaum, M. (
Fuzzi, B., Rizzo, R., Criscuoli, L., Noci, I., Melchiorri, L., Scarselli, B., Bencini, E., Menicucci, A. and Baricordi, O.R. (
Noci, I., Fuzzi, B., Rizzo, R., Melchiorri, L., Criscuoli, L., Dabizzi, S., Biagiotti, R., Pellegrini, S., Menicucci, A. and Baricordi, O.R. (
Sher, G., Keskintepe, L., Nouriani, M., Roussev, R. and Batzofin, J. (
Aldrich, C.L., Stephenson, M.D., Karrison, T., Odem, R.R., Branch, D.W., Scott, J.R., Schreiber, J.R. and Ober, C. (
Pfeiffer, K.A., Fimmers, R., Engels, G., van der Ven, H. and van der Ven, K. (
Kanai, T., Fujii, T., Unno, N., Yamashita, T., Hyodo, H., Miki, A., Hamai, Y., Kozuma, S. and Taketani, Y. (
Kapasi, K., Albert, S.E., Yie, S., Zavazava, N. and Librach, C.L. (
Fujii, T., Hamai, Y., Kozuma, S., Miki, A., Yamashita, T., Hyodo, H., Unno, N. and Taketani, Y. (
Cramer, P., Pesce, C.G., Baralle, F.E. and Kornblihtt, A.R. (
Emmer, P.M., Joosten, I., Schut, M.H., Zusterzeel, P.L., Hendriks, J.C. and Steegers, E.A. (
O'Brien, M., McCarthy, T., Jenkins, D., Paul, P., Dausset, J., Carosella, E.D. and Moreau, P. (
Donfack, J., Kogut, P., Forsythe, S., Solway, J. and Ober, C. (
Weiss, L.A., Lester, L.A., Gern, J.E., Wolf, R.L., Parry, R., Lemanske, R.F., Solway, J. and Ober, C. (
Nickerson, D.A., Tobe, V.O. and Taylor, S.L. (
Rozas, J., Sanchez-DelBarrio, J.C., Messeguer, X. and Rozas, R. (
Bandelt, H.J., Forster, P., Sykes, B.C. and Richards, M.B. (
Saitou, N. and Nei, M. (
Kimura, M. (
