


Abstract
To test the hypotheses that mutant huntingtin protein length and wild-type huntingtin dosage have important effects on disease-related transcriptional dysfunction, we compared the changes in mRNA in seven genetic mouse models of Huntington's disease (HD) and postmortem human HD caudate. Transgenic models expressing short N-terminal fragments of mutant huntingtin (R6/1 and R6/2 mice) exhibited the most rapid effects on gene expression, consistent with previous studies. Although changes in the brains of knock-in and full-length transgenic models of HD took longer to appear, 15- and 22-month CHL2Q150/Q150, 18-month HdhQ92/Q92 and 2-year-old YAC128 animals also exhibited significant HD-like mRNA signatures. Whereas it was expected that the expression of full-length huntingtin transprotein might result in unique gene expression changes compared with those caused by the expression of an N-terminal huntingtin fragment, no discernable differences between full-length and fragment models were detected. In addition, very high correlations between the signatures of mice expressing normal levels of wild-type huntingtin and mice in which the wild-type protein is absent suggest a limited effect of the wild-type protein to change basal gene expression or to influence the qualitative disease-related effect of mutant huntingtin. The combined analysis of mouse and human HD transcriptomes provides important temporal and mechanistic insights into the process by which mutant huntingtin kills striatal neurons. In addition, the discovery that several available lines of HD mice faithfully recapitulate the gene expression signature of the human disorder provides a novel aspect of validation with respect to their use in preclinical therapeutic trials.
INTRODUCTION
Huntington's disease (HD) results from a trinucleotide repeat expansion mutation in exon 1 of the huntingtin (HD, IT15) gene. The neurotoxicity of this mutation is conveyed through the expansion of polyglutamine stretch in the corresponding protein product, huntingtin (htt), which appears to disrupt multiple cellular processes. Among these is the apparent dysregulation of gene expression, which has recently been implicated through transcriptomic profiling and biochemical data on huntingtin protein interactions (1). Interest in this disease mechanism has gained additional momentum by virtue of preclinical trials showing that transcriptionally active drugs ameliorate disease phenotype (2–4).
A substantial number of models of HD are available to conduct studies aimed at understanding and eventually ameliorating the human disease. Differences among these model systems include the length of htt transprotein, length of polyglutamine repeat, origin of the mutated htt in the species, host organism species and strain and levels of htt expression. One may search among such models for answers to a particular etiological question based on how well the model system recapitulates the corresponding aspect of human disease.
R6 lines of mice were produced Mangiarini et al. (5), and were the first of the HD mice to be recorded. R6/2 mice express only the exon 1-encoded portion of the human htt transprotein with a large polyglutamine tract; they have a severe and rapidly declining molecular and behavioral phenotype, with significant motor and mRNA changes by 6 weeks of age (6–8). However, these mice show no significant neuronal loss until later time points, ruling out frank degeneration as the source of mRNA changes (9,10). R6/1 mice, a sister line to the R6/2, have a similar phenotype that becomes manifest on a slower timescale (5,11).
Additional transgenic HD mice expressing short N-terminal htt fragments [such as N171-82Q (12) and HD94 (13)] also have rapidly declining phenotypes that include changes in striatal gene expression (14,15). In contrast, HD mice expressing a longer N-terminal portion of htt with 46 polyglutamine repeats [HD 46 mice (16)] exhibit no detectable changes in gene expression up to 1 year, and a sister line with 100 repeats shows only subtle neurotransmitter receptor changes (16,17).
Mouse models designed to recapitulate more precisely the genetic lesion in human HD have been produced by inserting CAG repeats into the endogenous mouse HD homolog(Hdh) gene [including Hdh480Q (18), Hdh92Q (19), CHL2150Q (20), Hdh140Q (21)]. Also, transgenic mice have been produced using yeast artificial chromosomes carrying the human huntingtin gene [YAC72 (22) and YAC128 (23)]. These ‘full-length’ HD models have a normal or near-normal life span, but show molecular, cellular and behavioral phenotypes (19–21,23–26; M. Heng and R. Albin, unpublished data). To date, few gene expression changes have been described in murine HD models expressing full-length mutant htt (17,21,25,27).
In this report, we elaborate global transcriptomic comparisons between HD mice of all categories and human HD. The present study focuses on the gene expression in the striatum, the HD brain region demonstrating both the most dramatic neuropathology and the most extensive mRNA changes. Our data show that substantial components of the molecular HD phenotype can be captured in model systems, and that these profiles can provide a clear transcriptome level pattern of disease evolution. Surprisingly, both N-terminal and full-length mutant htt proteins demonstrate similar effects on transcription, whereas no detectable effect could be attributed to wild-type htt. Establishing the significant recapitulation of the transcriptomic HD phenotype by model systems also provides an important basis for further investigations of gene-expression-related HD mechanisms and therapeutics.
RESULTS
Striatal mRNA profiles of seven lines of HD mice expressing various forms of mutant htt (Table 1) and various gene dosages of wild-type htt were compared with each other and with a human HD caudate data set (28). Most of the mice were sampled de novo for these analyses, but cross-comparisons to previous data sets (where n ≥ 3 arrays were used) were also included. Each HD mouse model was analyzed for differential gene expression compared with age-, gender- and strain-matched wild-type counterparts (see Materials and Methods). Table 1 provides the details of the mouse strains, arrays and sample numbers employed for each data set.
HD model data sets and analyses
| Model and data set descriptions | Single-gene testing | Comparison with human HD | ||||||||||||||
|---|---|---|---|---|---|---|---|---|---|---|---|---|---|---|---|---|
| Model name | Ref. | Age | Straina | mHttb | wHttc | Qd | n mut | n wt | Array | Stagee | Raw P < 0.001 (dec./inc.) | FDR P < 0.05 (dec./inc.) | Concordance coefficient (c) | c rank | P-value rand. labels | P-value rand. genes |
| R6/2 | (5) | 6 w | B6/CBA | N.h | 2 | 150 | 7f | 7f | 430A | Early | 535 (370/165) | 676 (484/192) | +0.160 | 7 | 0.0735 | 0.006 |
| R6/2 (set 1) | (5) | 12 w | B6/CBA | N.h | 2 | 209 | 4 | 5 | 430 2.0 | Late | 2300 (1228/1072) | 4219 (1953/2266) | +0.405 | 3 | 0.0022 | 0.000 |
| R6/2 (set 2) | (5) | 12 w | B6/CBA | N.h | 2 | 209 | 5 | 4 | 430 2.0 | Late | 2432 (1178/1254) | 4683 (2056/2627) | +0.490 | 1 | 0.0001 | 0.000 |
| R6/1 | (5) | 24 w | CBA | N.h | 2 | 113 | 3 | 3 | U74Av2 | Early | 37 (37/0) | 0 (0/0) | +0.350 | 4 | 0.0065 | 0.000 |
| CHL2(HdhQ150) | (20) | 15 m | B6 | 2F.m | 0 | 150 | 3 | 3 | U74Av2 | Early | 5 (4/1) | 0 (0/0) | +0.265 | 5 | 0.0053 | 0.000 |
| CHL2(HdhQ150) | (20) | 22 m | B6/CBA | 2F.m | 0 | 155 | 4 | 4 | 430 2.0 | Late | 2448 (1460/988) | 3953 (2125/1828) | +0.440 | 2 | 0.0022 | 0.000 |
| HdhQ92 | (19) | 3 m | B6 | 2F.mg | 0 | 92 | 3 | 3 | 430 2.0 | 10 (4/6) | 1 (0/1) | −0.015 | 10 | 0.6094 | 0.739 | |
| HdhQ92 | (19) | 18 m | B6 | 2F.mg | 0 | 92 | 3 | 3 | 430 2.0 | Early | 211 (122/89) | 11 (7/4) | +0.130 | 8 | 0.0202 | 0.003 |
| Hdh480Q | (18) | 12 m | B6 | F.m | 1 | 80 | 3 | 3 | U74Av2 | 8 (4/4) | 0 (0/0) | 0.005 | 9 | 0.5097 | 0.807 | |
| YAC128 | (23) | 12 mh | FVB | F.h | 2 | 128 | 4 | 4 | 430 2.0 | 24 (20/4) | 0 (0/0) | −0.140 | 11 | 0.9738 | 0.992 | |
| YAC128 | (23) | 24 mh | FVB | F.h | 2 | 128 | 6 | 4 | 430 2.0 | 90 (34/56) | 7 (5/2) | +0.190 | 6 | 0.004 | 0.001 | |
| HD46i | (16) | 12 m | B6/SJL | N.h | 2 | 46 | 16 | 6 | 11K subB* | 6 (0/6) | 0 (0/0) | −0.205 | 12 | 0.9384 | 0.999 | |
RNA samples from seven different mouse models of HD were sampled at various time points, representing a range of disease stages (column ‘Model and data set descriptions’). Information under the column ‘Single-gene testing’ refers to numbers of probe sets meeting two different criteria for statistical significance in the moderated t-test. Concordance coefficient and permutation strategies to estimate chance probability of overlap are described in the text and Materials and Methods (data here are from N = 200 mouse genes) and are presented under the column ‘Comparison with human HD’. Faithful recapitulation of human disease by the model data set is demonstrated by c > 0 and P < 0.05. P-value estimates were obtained from 10 000 permutations (rand. labels) or 1000 permutations (rand. genes).
aPredominant mouse background strain(s): B6 = C57Bl/6J, FVB = FVB/N.
bmHtt, mutant htt-encoding genes: number of copies (one or two), protein coding length (N, N-terminal htt fragment; F, full-length htt), species (h, human; m, mouse).
cwHtt, number of copies (zero, one or two) of wild-type htt-encoding mouse Hdh genes.
dQ, mean polyglutamine-encoding CAG repeat expansion size for mutant allele (standard deviation of three to seven repeats).
eDisease stage assigned for meta-analysis (see text and Table 2).
fSaline-injected controls from two independent drug studies were combined for this analysis (see Materials and Methods).
gHuman HD exon 1 replaces exon 1 of mouse Hdh in HdhQ92/Q92.
h12-month and 24-month YAC128 data from (K. Becanovic, M. Pouladi, A. Kuhn, R. Luthi-Carter, M. Hayden and B. Leavitt, unpublished data).
iHD46 data from Chan et al. (17). All other data, this study.
Top-ranked early mouse changes concordant with human caudate
| R6/1 24w | R6/2 6w | CHL2 15m | Q92 18m | Human | Gene name | Gene symbol | U74A ps mouse | 430A ps mouse | U133 ps human |
|---|---|---|---|---|---|---|---|---|---|
| −0.83 | −0.93 | −0.94 | −0.99 | −0.80 | RAS, guanyl releasing protein 2 | RASGRP2 | 103282_at | 1417804_at | 208206_s_at |
| −0.51 | −0.83 | −1.03 | −0.51 | −1.47 | myelin transcription factor 1-like | MYT1L | 96496_g_at | 1460111_at | 210016_at |
| −0.57 | −0.63 | −0.40 | −0.54 | −1.04 | calcium channel, voltage-dependent, alpha2/delta subunit 3 | CACNA2D3 | 98300_at | 1419225_at | 219714_s_at |
| −0.69 | −0.87 | −0.77 | −0.44 | −1.08 | inositol 1,4,5-triphosphate receptor 1 | ITPR1 | 94977_at | 1457189_at | 211323_s_at |
| −0.71 | −0.33 | −0.37 | −0.83 | −1.09 | carbonic anyhydrase 12 | CA12 | 103905_at | 1428485_at | 204508_s_at |
| −0.25 | −0.54 | −0.76 | −0.96 | −1.07 | regulator of G-protein signaling 14 | RGS14 | 102711_at | 1419221_a_at | 211021_s_at |
| −0.68 | −0.53 | −0.32 | −0.64 | −1.60 | potassium voltage-gated channel, shaker-related subfamily, beta member 1 | KCNAB1 | 102725_at | 1448468_a_at | 210471_s_at |
| −0.70 | −1.12 | −0.78 | −1.08 | −1.23 | adenosine A2a receptor | ADORA2A | 101363_at | 1427519_at | 205013_at |
| −0.56 | −0.79 | −0.44 | −0.49 | −1.34 | hippocalcin | HPCA | 99944_at | 1450930_at | 205454_s_at |
| −0.55 | −0.28 | −0.31 | −0.89 | −1.71 | cannabinoid receptor 1 (brain) | CNR1 | 99892_at | 1434172_at | 213436_at |
| −0.71 | −1.42 | −1.08 | −0.84 | −1.68 | cAMP-regulated phosphoprotein 19 | ARPP-19 | 97259_at | 1422609_at | 214553_s_at |
| −0.69 | −0.83 | −0.40 | −0.69 | −0.77 | gamma-aminobutyric acid (GABA-A) receptor, subunit delta | GABRD | 99342_at | 1449980_a_at | 208457_at |
| −0.50 | −0.51 | −0.74 | −0.93 | −0.83 | ST8 alpha-N-acetyl-neuraminide alpha-2,8-sialyltransferase 3 | ST8SIA3 | 99504_at | 1451008_at | 208065_at |
| −0.47 | −0.41 | −0.24 | −0.54 | −1.03 | Rap 1 GTPase-activating protein | RAP1GAP | 160822_at | 1428443_a_at | 203911_at |
| −0.37 | −0.48 | −0.32 | −0.32 | −0.33 | potassium channel tetramerization domain containing 17 | KCTD 17 | 102099_f_at | 1435525_at | 205561_at |
| −0.48 | −0.33 | −0.46 | −0.63 | −0.60 | UDP-GlcNAc:beta Gal beta-1,3-N-acetylglucosaminyltransferase 2 | B3GNT2 | 160137_at | 1450026_a_at | 219326_s_at |
| −0.83 | −0.79 | −0.63 | −0.80 | −1.68 | coagulation factor C homolog (Limulus polyphemus) | COCH | 103317_at | 1423285_at | 205229_s_at |
| −0.33 | −0.23 | −0.38 | −0.57 | −0.29 | POU domain, class 3, transcription factor 1 | POU3F1 | 102652_at | 1460038_at | 210475_at |
| −0.54 | −0.74 | −0.55 | −0.48 | −0.72 | homer homolog 1 (Drosophila) | HOMER1 | 104499_at | 1437363_at | 226651_at |
| −0.40 | −0.78 | −0.35 | −0.59 | −0.42 | D site albumin promoter binding protein | DBP | 160841_at | 1418174_at | 209782_s_at |
| −0.75 | −0.54 | −0.31 | −0.74 | −1.52 | protein tyrosine phosphatase, non-receptor type 5 | PTPN5 | 100406_at | 1425131_at | 233471_at |
| −0.57 | −0.42 | −0.47 | −0.35 | −0.79 | ATPase, Ca2+ transporting, cardiac muscle, slow twitch 2 | ATP2A2 | 99570_s_at | 1443551_at | 212361_s_at |
| −0.53 | −0.72 | −0.51 | −0.81 | −0.56 | dopamine receptor 2 | DRD2 | 97776_s_at | 1418950_at | 206590_x_at |
| −0.45 | −0.32 | −0.67 | −0.36 | −0.33 | zinc finger protein 706 | ZNF706 | 97463_g_at | 1426678_at | 227132_at |
| −0.37 | −0.51 | −0.80 | −0.90 | −0.37 | retinoid X receptor 2 | RXRG | 92237_at | 1418782_at | 205954_at |
| −0.81 | −1.41 | −0.24 | −1.26 | −1.38 | preproenkephalin 1 | PENK | 94516_f_at | 1427038_at | 213791_at |
| −0.64 | −0.61 | −1.02 | −0.43 | −1.11 | protein kinase C beta 1 | PRKCB1 | 99510_at | 1460419_a_at | 228795_at |
| −0.34 | −0.33 | −0.40 | −0.22 | −0.43 | spermidine synthase | SRM | 92540_f_at | 1421260_a_at | 201516_at |
| −0.62 | −1.00 | −0.26 | −0.75 | −0.91 | phosphodiesterase 1B, Ca2+-calmodulin dependent | PDE1B | 93382_at | 1449420_at | 206444_at |
| −0.64 | −0.55 | −0.61 | −0.40 | −0.58 | ATPase, Ca2+ transporting, plasma membrane 2 | ATP2B2 | 95324_at | 1433888_at | 211586_s_at |
| −0.39 | −0.35 | −0.32 | −0.58 | −1.36 | protein phosphatase 3, catalytic subunit, alpha isoform | PPP3CA | 95092_at | 1438478_a_at | 202429_s_at |
| −0.38 | −0.65 | −0.53 | −0.54 | −0.64 | microtubule-associated serine/threonine kinase 3 | MAST3 | 104032_at | 1435666_at | 213045_at |
| −0.47 | −0.35 | −0.39 | −0.51 | −0.47 | sarcolemma-associated protein | SLMAP | 98553_at | 1426457_at | 225243_s_at |
| −0.39 | −0.46 | −0.25 | −0.36 | −0.66 | calcium/calmodulin-dependent protein kinase II, beta | CAMK2B | 100453_at | 1448676_at | 213276_at |
| −0.35 | −0.43 | −0.23 | −0.25 | −0.57 | deiodinase, iodothyronine, type II | DIO2 | 103438_at | 1418938_at | 231240_at |
| −0.38 | −0.23 | −0.44 | −0.49 | −1.00 | phospholipase C, beta 1 | PLCB1 | 92465_at | 1425781_a_at | 213222_at |
| −0.24 | −0.42 | −0.37 | −0.36 | −1.10 | potassium voltage-gated channel, subfamily Q, member 2 | KCNQ2 | 99449_at | 1451595_a_at | 205737_at |
| −1.17 | −0.25 | −1.35 | −0.81 | −1.56 | regulator of G-protein signaling 4 | RGS4 | 94155_at | 1448285_at | 204337_at |
| −0.33 | −0.63 | −0.49 | −0.72 | −0.39 | potassium channel, subfamily K, member 2 | KCNK2 | 104652_at | 1449158_at | 210261_at |
| −0.44 | −0.81 | −0.20 | −0.44 | −0.75 | brain-specific angiogenesis inhibitor 1-associated protein 2 | BAIAP2 | 99337_at | 1451027_at | 205294_at |
| −0.44 | −0.49 | −0.28 | −0.41 | −0.22 | ubiquitin-specific peptidase 2 | USP2 | 92820_at | 1417168_a_at | 229337_at |
| −0.29 | −0.52 | −0.30 | −0.29 | −0.36 | coronin, actin-binding protein, 2B | CORO2B | 97365_at | 1434775_at | 209789_at |
| −0.33 | −0.35 | −0.34 | −0.40 | −0.80 | mannosidase 1, alpha | MANIA1 | 160580_at | 1417111_at | 221760_at |
| −0.38 | −0.15 | −0.25 | −0.36 | −0.28 | membrane-bound transcription factor peptidase, site 1 | MBTPS1 | 95754_at | 1448240_at | 217543_s_at |
| −0.61 | −0.73 | −0.55 | −0.40 | −0.75 | chemokine (C-X3-C motif) ligand 1 | CX3CL1 | 98008_at | 1415803_at | 823_at |
| −0.16 | −0.41 | −0.17 | −0.49 | −0.52 | rho guanine nucleotide exchange factor (GEF7) | ARHGEF7 | 98434_at | 1449066_a_at | 242999_at |
| −0.50 | −0.65 | −0.37 | −0.57 | −0.55 | seizure-related gene 6 | SEZ6 | 92757_at | 1427674_a_at | 243430_at |
| −0.32 | −0.55 | −0.33 | −0.42 | −0.51 | myeloid ecotropic viral integration site-related gene 1 | MEIS2 | 97988_at | 1443926_at | 207480_s_at |
| −0.26 | −0.30 | −0.20 | −0.28 | −1.15 | protein phosphatase 1, regulatory (inhibitor) subunit 1A | PPP1R1A | 96114_at | 1422605_at | 205478_at |
| −0.34 | −0.55 | −0.49 | −0.32 | −0.62 | cytoplasmic FMR1 interacting protein 2 | CYFIP2 | 102009_at | 1442167_at | 220999_s_at |
| −0.23 | −0.43 | −0.13 | −0.42 | −0.50 | Harvey rat sarcoma virus oncogene 1 | HRAS | 160536_at | 1424132_at | 212983_at |
| −0.34 | −0.50 | −0.34 | −0.39 | −0.80 | guanine nucleotide-binding protein, beta 5 | GNB5 | 100122_at | 1422208_a_at | 207124_s_at |
| −0.18 | −0.24 | −0.13 | −0.26 | −0.30 | selenophosphate synthetase 1 | SEPHS1 | 94793_at | 1455511_at | 208940_at |
| −0.25 | −0.39 | −0.19 | −0.27 | −0.70 | adaptor protein complex AP-1, sigma 1 | AP1S1 | 160552_at | 1416087_at | 205196_s_at |
| −0.21 | −0.34 | −0.46 | −0.33 | −0.92 | guanine nucleotide-binding protein, alpha | GNAO1 | 161902_f_at | 1448031_at | 204762_s_at |
| −0.30 | −0.17 | −0.17 | −0.29 | −0.36 | cDNA sequence BC008155 | C16orf24 | 94933_at | 1425323_a_at | 219709_x_at |
| −0.38 | −0.69 | −0.26 | −0.70 | −1.13 | retinal-binding protein 4, plasma | RBP4 | 96047_at | 1426225_at | 219140_s_at |
| −0.41 | −0.91 | −0.24 | −0.38 | −1.28 | neuronal guanine nucleotide exchange factor | NGEF | 93178_at | 1448978_at | 227240_at |
| −0.69 | −0.55 | −0.72 | −0.35 | −0.44 | calcium/calmodulin-dependent protein kinase II alpha | CAMK2A | 93659_at | 1443876_at | 213108_at |
| −0.20 | −0.23 | −0.27 | −0.19 | −0.35 | myeloid leukemia factor 2 | MLF2 | 95726_at | 1423916_s_at | 200948_at |
Early stage gene expression changes present in multiple models. All genes meeting the criteria of mean rank ≤ 1000 for mouse, rank ≤ 5000 in human and concordant sign of change across all five disease conditions are shown. Number in each column represents log2 fold change of differential expression in each HD group.
To compare the relative signal magnitudes in each HD mouse data set, we examined the distributions of nominal P-values from probe set-wise differential expression tests. Data sets showing a significant signal are expected to have a higher proportion of low P-values, whereas the P-values in the absence of such a signal should be distributed randomly, giving a flat histogram. As shown in Figure 1, such a distinct peak of small P-values was observed in the 6- and 12-week R6/2, 22-month CHL2Q150/Q150 and 18-month HdhQ92/Q92 data sets. To summarize the strength of the differential gene expression signature, we calculated the number of probe sets meeting the defined statistical criteria in each model (nominal P-value is < 0.001 or false discovery rate (FDR)-corrected P-value is < 0.05, Table 1 in columns headed ‘Single-gene testing’). The number of probe sets meeting these criteria was considerably higher for some data sets than that of others, indicating different levels of detectable differential expression. Nonetheless, several models have changes in gene expression that can be identified on a single gene-testing basis.
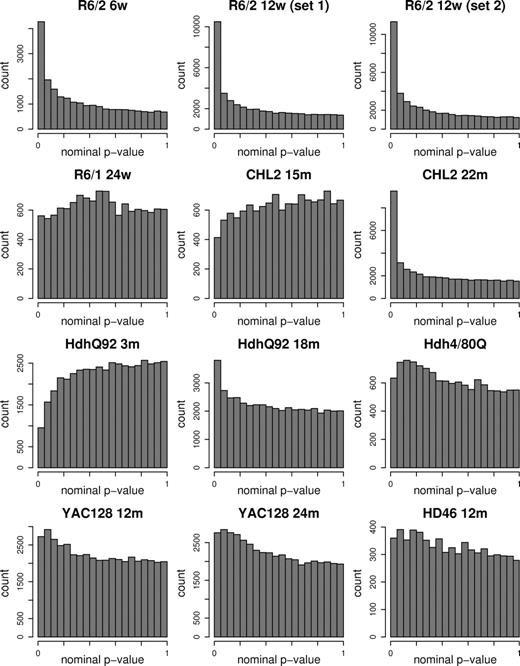
Nominal P-value distributions for differential expression. Model and data set descriptions and differential expression summaries are provided in Table 1.
To determine the extent to which the various HD models recapitulate the transcriptomic changes in human HD caudate, we compared the mouse HD profiles with microarray data from human samples of pathological Grade 2 or below (28) (complementary analysis is given in Supplementary Material, Table S1). Quantifying the similarity of each model's overlap to the human data should thus provide a relative measure of its ability to reproduce the signature of HD.
The determination of concordant gene expression between human HD and its mouse models considered whether the statistically top-ranked mRNAs in each mouse data set were consistent with the differential mRNA expression observed in human HD caudate. First, the top 200 differentially expressed genes in each model were determined (including both increases and decreases) and each mouse gene was mapped to its corresponding human ortholog. Then, the direction of each change in expression was taken into account, and same-direction changes were distinguished from changes with opposite signs (Fig. 2). As a third step, a statistical cutoff for the human comparison was implemented in order to restrict the overlap to changes identified as statistically significant in human. Thus, a concordant change was defined as one showing the same-signed change in expression (increased or decreased in both mouse and human) meeting a false discovery rate cutoff of P < 0.05 in the human analysis. For each data set, we then summarized its interaction with human HD data set using a concordance coefficient (c), which tallied concordant minus discordant regulations (as described in Materials and Methods; data presented in Table 1 in ‘Concordance coefficient’ column). To estimate the significance of the relationships between the model and human data sets, we compared the actual concordance coefficients with coefficients obtained from analyses where the human sample labels were randomly assigned (Table 1 in ‘P-value rand. labels’ column). Alternatively, we compared the actual concordance coefficients with coefficients calculated from randomized selections of mouse probe sets mapped to the human differential expression list (Table 1 in ‘P-value rand. genes’ column).
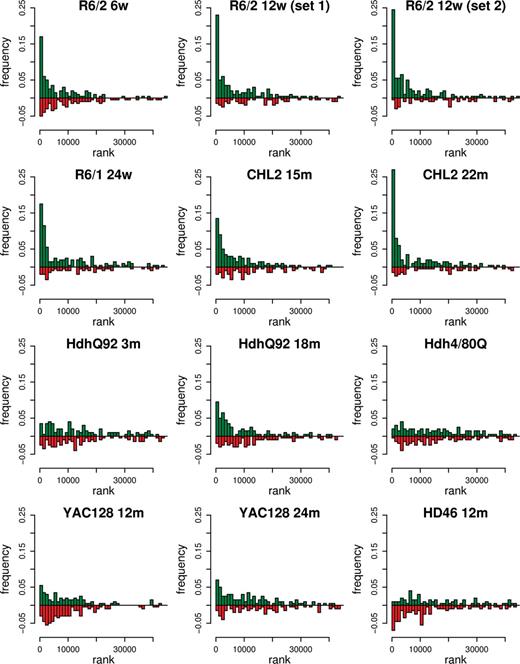
Distribution of top 200 mouse expression changes in the human data set. For each set of differential expression measures (HD mouse versus wild-type or human HD versus control), genes were ranked by absolute moderated t (see Materials and Methods). Orthologs of the top-ranking mouse genes were then identified in the human data set and displayed in the histogram according to human rank. Same sign regulations (increased or decreased in both mouse and human HD) are shown in green; opposite sign regulations (increased in mouse and decreased in human, or vice versa) are shown in red. Frequency represents the fraction of the top 200 mouse expression changes that map to a particular bin of ranks in the human data set (1000 probe sets in each bin). A higher frequency of concordant (green) than discordant (red) mouse–human ortholog pairs falling within the top 13 862 human ranks (corresponding to FDR P < 0.05) indicates similarity between model and human HD signatures. The assessment of these patterns for significant relationships between mouse and human data sets is represented by the concordance coefficient and corresponding P-value estimations (Table 1).
The qualitative assessment of which models showed bona fide HD signal was similarly assigned using both of these approaches (Table 1). Mouse data sets showing the highest concordance with human HD were those from 12-week R6/2 and 22-month CHL2Q150/Q150 animals, but concordance with the data from 24-week R6/1 animals, and 18-month HdhQ92/Q92 animals were also significant (P < 0.05). Interestingly, these analyses also indicated that two of the data sets that showed no clear signs of gene expression changes on a single-gene testing basis, those from the 15-month CHL2Q150/Q150 mice and 24-month YAC128 mice, also had significant overlap with the gene expression signature of the human HD caudate (Table 1, Fig. 2). Providing a relative measure of similarity to human HD, the concordance coefficients and corresponding ranks of all model data sets are presented in Table 1. To visualize the correlation of fold-change and to consider the specific direction of change (increased versus decreased), complementary scatter plots illustrating these features of the data are presented in Figure 3. For mouse models with a significant similarity to human HD, there was generally higher concordance between mouse and human data where expression of particular mRNAs was decreased.
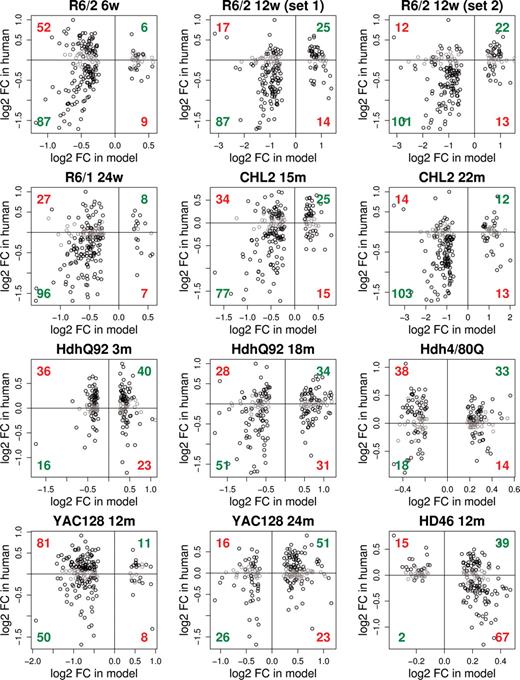
Scatter plots of differential expression in model versus human HD. These plots provide additional detail about the concordant and discordant changes shown in Figure 2 and pictorially represent the bases of the concordance coefficients for each model (data in Table 1; procedural descriptions in Results and Materials and Methods). Numbers summarizing same sign regulations are shown in green (increased in both mouse and human HD, top right quadrants; decreased in both mouse and human HD, bottom left quadrants); numbers summarizing opposite sign regulations are shown in red (increased in mouse and decreased in human, bottom right quadrants; decreased in mouse and increased in human, top left quadrants). Grey cirles indicate human orthologs where FDR P ≥ 0.05 in human HD (i.e. orthologs where differential expression in human is considered non-significant) and are not scored as either concordant or discordant.
Mouse models showing robust HD signal comprised both N-terminal fragment and full-length models. To address particular aspects of HD pathogenesis that might be differentially represented across models and time points, we compared the collected data sets with one another. On the basis of different protein contexts of the mutant polyglutamine stretch in the knock-in and N-terminal fragment models, we hypothesized that the two classes of models might show different patterns of gene expression changes. One could postulate, for example, that animals expressing full-length mutant htt might display changes related to both mutant full-length and N-terminal fragment effects and so an additional set of gene expression changes would be evident in these animals. We thus attempted to identify specific gene expression changes that would distinguish between the two types of models, and thereby delineate unique effects of full-length mutant htt.
As preliminary results indicated that array type might have a significant effect on data set discrimination, we increased the homogeneity of comparisons by restricting analyses to data sets collected on arrays with identical probes (MOE 430). Cluster analysis using top knock-in, truncated, transgenic or human HD gene expression changes or most variable genes across all HD mouse models typically discriminated between data sets with significant HD signal and those without, but provided no discrimination between N-terminal and full-length HD models (Fig. 4). On the other hand, the emergent pattern was that models sampled during later stages of disease (22-month CHL2Q150/Q150 and 12-week R6/2) consistently clustered together. The strong similarity of late stage models is also demonstrated by their correlation coefficients of differential expression (fold-change, Fig. 4, bottom panels), where data from late stage models are more highly correlated with each other than with models of the same respective type (N-terminal or full-length).
![Correlation of M (log2 fold change) of HD effect across mouse models and discrimination of HD model subsets. Top left panels: Heat maps depict correlation coefficients of M for all pairwise comparisons between models. Genes selected by rank in the data set indicated [(A) 22-month CHL2Q150/Q150; (B) 12-week R6/2]. Top right panels: hierarchial clustering of models based on differential expression of gene sets indicated. Bottom panels: Scatter plots of M are shown (for all pairs of models) for gene sets indicated, with correlation coefficients. For all panels, selection of variable numbers of top-ranking genes (100–1000) achieved similar results. Qualitatively similar results were also obtained using top-ranked genes from human other model data sets, as well as with a selection of the most variable genes across all models.](https://oup.silverchair-cdn.com/oup/backfile/Content_public/Journal/hmg/16/15/10.1093_hmg_ddm133/1/m_ddm13304a.jpeg?Expires=1716576788&Signature=NIT7BAWepZGIahJNIWC51F1uNTspHIOGtnK-khaEHrs~bopMjFYzwwFKLa~O5~CZRkUZlBfhUxxWMRhhOE2H8iD6jZQXUCMu2pRd1Cd9OBXTj-Z7G6eFPpf2yj0LfrVQhOx7-DrUDFi31kuUxIac3DBUsE0ZLTsGexFotVTOtXh06NkBk29TBI3jly1HdRyAi3BB3EVjs0IpotmBd2-OJiz924W5QeZciaaP6RI29AOOPbtTbPzq4X72irQy3BxlrSoxv77i~Qou-2APkoFjERz2UHrNtGwfvHGslNLbPYb4XaC4yV4nLO46uhJeEUFHWuCWom-qBdBu4s-XACCCmA__&Key-Pair-Id=APKAIE5G5CRDK6RD3PGA)
![Correlation of M (log2 fold change) of HD effect across mouse models and discrimination of HD model subsets. Top left panels: Heat maps depict correlation coefficients of M for all pairwise comparisons between models. Genes selected by rank in the data set indicated [(A) 22-month CHL2Q150/Q150; (B) 12-week R6/2]. Top right panels: hierarchial clustering of models based on differential expression of gene sets indicated. Bottom panels: Scatter plots of M are shown (for all pairs of models) for gene sets indicated, with correlation coefficients. For all panels, selection of variable numbers of top-ranking genes (100–1000) achieved similar results. Qualitatively similar results were also obtained using top-ranked genes from human other model data sets, as well as with a selection of the most variable genes across all models.](https://oup.silverchair-cdn.com/oup/backfile/Content_public/Journal/hmg/16/15/10.1093_hmg_ddm133/1/m_ddm13304b.jpeg?Expires=1716576788&Signature=iJkGRE9jraB6On8WWHZ2vt~F01KpZxS60LM~6uqxbDtpRZccNdSY6t5MJlqe9Iwkf-WszGGE9Pg-W8DsWFOZelB-hVrEE5sjqAw4MFU5fkWi7mPfx8-4qD9GdE1nlxOat83ZNT9-7ln5FfrM5X48~SBeIkBzdwEij8P6yR66B5SRKJy-w2jQ5tx1O8fRaaDOYCgWOA64KJGGqQ5L693k-MOa0~xxVqmA7b9~jdVJMkNgqheB4i9wRaiHxQV-JVv1ulCOTWAcIW8eRXdpIq4~xeeUsNDGRwopfnALmTn7xe~vpESdkgO3YzFDaANNo2pkOPOpva0QOgIjOpNSChGoDg__&Key-Pair-Id=APKAIE5G5CRDK6RD3PGA)
Correlation of M (log2 fold change) of HD effect across mouse models and discrimination of HD model subsets. Top left panels: Heat maps depict correlation coefficients of M for all pairwise comparisons between models. Genes selected by rank in the data set indicated [(A) 22-month CHL2Q150/Q150; (B) 12-week R6/2]. Top right panels: hierarchial clustering of models based on differential expression of gene sets indicated. Bottom panels: Scatter plots of M are shown (for all pairs of models) for gene sets indicated, with correlation coefficients. For all panels, selection of variable numbers of top-ranking genes (100–1000) achieved similar results. Qualitatively similar results were also obtained using top-ranked genes from human other model data sets, as well as with a selection of the most variable genes across all models.
When considered together, the numbers and directions of mRNA changes across mouse model and human HD data sets showed interesting relationships (Table 1). Overall, the earliest stage models exhibited fewer changes, and these were predominantly decreases in expression. As the model phenotype became more severe (as over time with R6/2 or CHL2Q150/Q150), the total number of expression changes increased, and the ratio of increased to decreased changes became approximately 1:1. As considered in the previous section, the pattern of molecular changes in the late stage mice is closest to that seen in human postmortem HD tissue. Therefore, it is exiting to consider that the potential continuum of mRNA pathology may accurately be represented by the mice as well, with the early stage mice providing information not readily observable in human HD brain, due to the limited availability of human tissues representing the very earliest pathological events.
To explore whether there might be identifiable biological explanations for the differences between the late stage and early stage mice, we subjected differential expression lists to cellular and molecular pathways analyses. To focus on changes relevant to human HD, we considered only concordant changes in mice whose orthologs were significantly dysregulated in human. Unfortunately, however, gene ontology analyses were unable to detect over- or under-represented pathways significantly in these gene sets and thus no specific differences were revealed.
To identify robust molecular indicators that might provide important information about early disease mechanisms, we defined the most consistent gene expression changes across multiple early-stage HD mice (6-week R6/2, 24-week R6/1, 18-month HdhQ92/Q92 and 15-month CHL2 Q150/Q150 mice; Supplementary Material, Table S1) using a mean rank strategy (see Materials and Methods and Table 2 legend). Supporting the robustness of the approach, this meta-analysis list showed a significant concordance with human HD caudate (c = 0.25; P = 0.023). We further subselected concordant gene expression changes by eliminating those that could not be shown to recapitulate changes in low pathological grade HD brain, and present the top genes identified by this strategy to define early disease events in Table 2. (Full meta-analysis of early and late model changes is available in Supplementary Material, Tables S2 and S3.) The concordant early changes include both expected (DRD2, ADORA2A, CNR1 and PENK) and novel mRNAs (RASGRP2, MYT1L and CA12) relative to previous reports, with a large fraction nonetheless being involved in striatal signaling (11,14,28). It is anticipated that the use of these robust disease indicators may help to focus transcription-related hypotheses of HD pathogenesis.
DISCUSSION
In this report, we compare the full transcriptomic profile of a human neurological disease with those of genetic murine models of the same disease produced in different laboratories. The benefit of this strategy is that it yields an unbiased analysis of the extent to which the mouse model accurately represents the disease it attempts to recapitulate. One noteworthy limitation of this method is that potentially important features of disease beyond mRNA level changes escape detection. Another limitation to be considered is that our data represent only a small number of animals from each line and time point. Nonetheless, valuable conclusions can be drawn from animals showing significant HD signal, particularly where concordance between multiple models is observed.
Although statistical treatment of microarray expression measures has largely been refined to a point of consensus, strategies for global comparisons between large expression data sets are less well established. Although several methods for testing gene set enrichment have been proposed to define and quantify similarity between transcriptomic information (29–31), one often-discounted element is the sign of differential expression (increased versus decreased). In the context of many problems, such as the one considered here, it is of high biological relevance that the change in the expression is concordant between the two systems considered (32); here, the modeling would not be considered accurate if, for example, genes underexpressed in human disease were overexpressed in the mouse. We implemented a simple strategy of assessing transcriptomic concordance between mouse and human based on both the rank and sign of the change in each data set. This measure takes into account the strength of disease signal (i.e. the number of accurately reproduced changes) as well as penalizing ‘incorrect’ regulations. Our proposed measure has a clear biological interpretation and is amenable to statistical testing by appropriate permutation of the data.
The major finding of this study is that several available genetic mouse models of HD reliably reproduce the transcriptomic changes of the human HD caudate. This is an exciting discovery because it suggests that the process by which these changes arise in the models may also be similar, and therefore the study of these models may translate well to understand human HD. In addition to being relevant for new target identification, this finding indicates that the available models may be valid for testing current therapeutic strategies directed at the same pathway(s).
The results of the present study can inform the choice of models to study changes in gene expression and the timeline in which such changes can be expected in various model systems. We cannot be certain about the extent to which the present transcriptomic analyses can be extrapolated to other models, but previous evidence shows that some lines not included here, such as N171-82Q and HD94, do exhibit similar mRNA changes (14,15). Also, a global view of the present data suggests that all mutant htt-expressing mice would show relevant mRNA changes if the rodent lifespan allowed sufficient disease progression.
There are nonetheless some noteworthy differences between the molecular and cellular aspects of the HD models employed here and the corresponding characteristics of the adult-onset human disorder. The first is that all models demonstrating gene expression changes possess CAG repeat lengths atypical of human cases, comprising the equivalent of an allele causing an early-onset juvenile form of HD. In addition, several of the models used here are known to have much less brain regional specificity than adult-onset HD, both in terms of histopathology and differential gene expression (8,10,25,28, M. Heng and R. Albin, in preparation, R. Luthi-Carter, A. Hannan and J.-H.J. Cha, unpublished data). Therefore, one cannot rule out that the transcriptomic changes occurring in these models are more representative of rare juvenile-onset disease, where a more widespread pathology and a different clinical profile are observed.
The similarity between the transgenic mouse models and human HD was much stronger for the genes that are downregulated with disease (Fig. 3). This finding is consistent with the identification of a set of polyglutamine dysregulated genes subject to an inhibitory effect of mutant htt on the transcriptional machinery (see below). On the other hand, the increases in gene expression observed in models at late stages also show a statistically significant relationship to HD, and therefore should not be discounted. One potential confounding effect in the late-stage mice is that the loss of striatal neurons and relative increase in glial number may account for some of the apparent changes in expression, and we did not address this point in the present study. Whether particular changes in gene expression occur at an mRNA/neuron level will therefore require additional analyses with complementary methods such as in situ hybridization histochemistry or neuronal microdissection (28,33). Cell loss in early-stage HD mice is absent or minimal, and thus would not be anticipated to have an impact on the array results.
We were surprised not to be able to identify differences between models expressing an N-terminal fragment and those expressing full-length htt proteins. The fact that both have similar effects on gene expression suggests that these effects are caused by the polyglutamine-bearing region of the protein. On the other hand, the more protracted timeline of this effect in the full-length models is consistent with the hypothesis that transcriptional dysregulation is dependent on the nuclear accumulation of a proteolytically derived N-terminal huntingtin fragment (34), supporting that the inhibition of this step may be a promising therapeutic strategy.
It is also interesting to consider that the transcriptomic profiles of the mice do not show a discernable effect of the varying copy numbers of genes encoding wild-type htt (Table 1). For example, the CHL2Q150/Q150 and R6 mice show similar profiles, despite the fact that the CHL2Q150/Q150 expresses no wild-type htt at all whereas the R6/2 has two intact copies of the Hdh gene. Taken at face value, this would be inconsistent with a loss-of-htt-function hypothesis (35), although sequestration of wild-type htt through co-aggregation or some other ‘dominant-negative’ action of mutant htt remains plausible explanations.
Although signaling and metabolic perturbations remain plausible mechanisms for transcriptomic changes in HD (36,37), there is considerable support for the hypothesis that mutant htt has a more direct effect on gene expression. The strongest evidence for a link between RNA biogenesis and HD pathogenesis is the observation of aberrant interactions between mutant htt and transcriptional regulatory proteins. These reported interactors include Sp1 (38), CBP (39), NCoR (40), CtBP (41), CA150 (42) and REST/NRSF (37). In most cases, these interactions have been shown to change the factors' abilities to control gene expression in a polyglutamine-length-dependent manner. The polyglutamine-length-dependent inhibition of histone acetylation has also been observed, and the reversal of histone acetylation deficits by the administration of histone deacetylase inhibitors improves the abnormal phenotype in yeast, Drosophila, cell and mouse models of polyglutamine disease (2,3,43,44). In parallel, hypermethylation of histones has also been observed, and this can be ameliorated with anthracycline antibiotics in HD mice (45,46).
While much is known about transcriptomic dysregulation in HD models, the extent to which this information would be relevant to human disease has not previously been established. The present findings support that HD mice are indeed a valid substrate for studying mechanisms underlying gene expression changes in HD. Further, the reference signature provided by early-stage HD mice may be informative in prioritizing the future study of transcription-related mechanisms of HD pathogenesis.
MATERIALS AND METHODS
Human and mouse samples and differential gene expression analysis
Human samples, microarray processing and quality control as well as statistical analysis were performed essentially as described in Hodges et al. (28). Statistical analyses were carried out with open source R software packages available as part of the Bioconductor project (http://www.bioondutor.org). After quantification of gene expression by robust multi-array analysis (47,48) using the affy package (49), differential gene expression between HD (Grades 0–2) and controls was determined by computing empirical Bayes moderated t-statistics with the limma package (50,51), including all probe sets and correcting gene expression for collection site (Boston or New Zealand), gender and age (< 45, 45–60, 60–70 and > 70years).
For each mouse HD model, we quantified gene expression as for human samples. The number of mutant and wild-type samples used for the analysis of each model mouse is indicated in Table 1. Differential gene expression between each HD model and its respective wild-type controls was determined by computing empirical Bayes moderated t-statistics with the limma package (50,51), including all probe sets. Samples from 6-week-old R6/2 mice were pooled across two experiments (sample sizes of three and four, respectively) and we (linearly) corrected gene expression for experimental group.
Comparison of differential gene expression in HD models versus HD patients
Orthologous probe sets on mouse and human microarrays were matched using the Bioconductor package annotationTools and HomoloGene, as of August 2006 (52).
Data from each of the HD mouse models were compared with the human HD signature as follows: we selected the top N non-redundant probe sets (i.e. representing N different genes) showing most significant differential expression between mutant and wild-type animals (i.e. the N non-redundant probe sets with highest absolute mod t-statistic) and having one or more orthologous probe sets in human data. Note that in the case of multiple orthologous probe sets (i.e. annotated to a single gene), we retained the orthologous probe set detecting the most significant expression change and excluded the others. Differential mRNA expression reported by pairs of (orthologous) probe sets detecting a change in the same direction in mouse and human (i.e. up- or downregulation in both mouse and human) was called concordant; opposite direction changes detected by a pair of orthologous probe sets in mouse and human was called discordant (i.e. upregulation in mouse and downregulation in human, or the reverse). We identified the ranks of orthologous probe sets in the list of all human probe sets ordered by decreasing evidence of differential expression (i.e. increasing P-value or decreasing absolute value of the mod t-statistic) and displayed them in two separate histograms: one for concordant probe sets and the other for discordant probe sets. Strong over-representation of changes in low ranks indicated association between top differentially expressed genes in HD mice and HD patients.
where #concordant is the number of concordant orthologous probe set pairs, #discordant the number of discordant orthologous probe set pairs and N the number of mouse probe sets selected for the comparison. c ranges from − 1 to 1 and is interpreted as the normalized difference between the number of concordant and discordant regulations. c takes a value of 1 if all orthologous probe sets pairs are concordant and a value of − 1 if they are all discordant. A value of 0 either indicates that there are as many discordant as concordant orthologous probe sets or that no pair is concordant or discordant (i.e. none of the human orthologs shows significant differential gene expression).
We tested the strength of association between the mouse disease signature (i.e. the N selected differentially expressed mouse genes) and human HD signature, as measured by the concordance coefficient, in two different ways. First, we tested whether the association of the model signature with the human HD signature was significantly stronger than with an arbitrary (non-HD) human signature. For this purpose, we generated random human signatures by permuting the original gene expression measures Yij: for each probe set i in the human data, we obtained a permuted set of expression values Yij* (with i = 1, …, I, I the total number of probe sets, and j = 1, …, J, J the total number of patients) and obtained an estimate of Mi* the log2-fold change between groups for the permuted values by least squares fitting of the statistical model as for the original data (see ‘Human and mouse samples and differential gene expression analysis’). The permutation was the same for all I probe sets, such that the correlation between different probe set values was left unchanged. We repeated the permutation step and obtained 10 000 estimates of Mi*. This procedure can be used to estimate the distribution of Mi* and test whether mean expression was equal in HD and control patients [i.e. to assess significance of the original Mi (54,55)]. For each permutation, we thus recalculated the (permuted) concordance coefficient c* based on the log fold change for the N selected mouse regulations and the (permuted) log fold change estimates Mi* for the corresponding N orthologous probe sets. Thus, c* provided an estimate of the association strength of the HD model signature with a random human signature and the permutation distribution was used to test for an excess of concordance. Specifically, we reject the null hypothesis if #{c* ≥ c}/10000 < 0.05, and concluded accordingly that the concordance coefficient observed between the HD model and the human HD signature was significantly larger than that between the HD model and an arbitrary human signature (Table 1, column ‘P-value rand. labels’).
Second, we tested if the association of each model signature with the human HD signature was significantly stronger than the association of a corresponding random mouse signature with the human HD signature (Table 1, column ‘P-value rand. genes’). For each model, we thus generated random mouse signatures by drawing (without replacement) groups of N non-redundant mouse probe sets (i.e. N probe sets annotated with N different genes) with at least one orthologous probe set in humans. In the case of multiple orthologous probe sets, we included the probe sets showing the most significant differential expression. For each model, we then obtained the concordance coefficient c* for each of 1000 random mouse signatures and used this permutation distribution to carry out the test [see Goeman and Buhlmann (56) for a discussion of these two sampling schemes]. Small changes in N (100–1000) did not qualitatively alter the results obtained; data presented in Table 1 and Figures 2 and 3 are for N = 200.
Comparison of gene expression changes in different HD models
To investigate whether subsets of the HD models shared similar patterns of gene expression changes and, in particular, to ask whether they might recapitulate human HD in different ways, we performed hierarchial clustering. To reduce technical heterogeneity, we limited this analysis to data sets collected on Affymetrix Mouse 430 GeneChips (i.e. R6/2 6w, R6/2 12w, CHL2Q150/Q150 22m, HdhQ92/Q92 3m, HdhQ92/Q92 18m, YAC128 12m and YAC128 24m) and to probe sets present on both 430A and 430 2.0 formats (i.e. all probe sets on 430A arrays). Where multiple mouse probe sets representing a single gene were identified, we selected the mouse probe set reporting the largest absolute fold-change across HD models (i.e. we selected the probe set with the largest sum of squared log2 fold changes in the seven data sets). We then selected the top 200 differentially expressed genes from different data sets and used the corresponding log2 fold changes in each model to calculate the pairwise distances between every pair of HD models (based on Pearson's correlation coefficient) and clustered them using Ward's agglomeration method (57). We first investigated whether the seven models might recapitulate human HD in different ways by clustering based on the top 200 human mRNA changes. In addition, we explored whether mouse models expressing the full-length mutant htt would show different changes in gene expression than those expressing N-terminal htt fragments by clustering using the top 500 probe sets for either the 22m CHL2Q150/Q150 data set or 12 w R6/2 data set, representing prototypical full-length and N-terminal fragment models, respectively.
In order to define uniform HD-related gene expression changes seen in multiple lines of mice, and to compare such coordinate mouse regulations with those of human HD, we implemented a meta-analysis strategy. We built two lists of genes with same-sign regulations over four ‘early-stage’ models (R6/1, R6/2 6 weeks, CHL 2, HdhQ92/Q92 18 months, hybridized on array format MG-U74Av2, 430 2.0, MG-U74Av2, 430 2.0, respectively) and, separately, over two ‘late-stage’ models (R6/2 12 weeks and CHL2Q150/Q150 22 months, both hybridized on array 430 2.0). For the former list, we used gene IDs annotation provided by Affymetrix (07/27/2006) to map probe sets across the different array formats. If multiple probe sets were annotated with a single gene ID, we kept the probe set showing the most significant expression change. We then selected genes targeted by a probe set on all arrays and ordered them according to their average rank over the individual lists of differentially expressed genes (ordered by decreasing absolute mod t-statistic). Genes with the lowest average ranks (i.e. consistently differentially expressed in all of the HD models) showed largely concordant regulations in the various HD models. Finally, we mapped genes with concordant regulations over the HD models to their human orthologs and compared them with the (human orthologous) regulations found in HD patients.
SUPPLEMENTARY MATERIAL
Supplementary Material is available at HMG Online.
ACKNOWLEDGEMENTS
We are grateful to Peter Detloff, Asa Petersen and Andreas Kremer for critical reading of the manuscript. We also thank Peter Detloff and Jesse Hunter for sharing unpublished microarray data, and Ayshe Beesen and the staff of the Lausanne DNA array facility for technical assistance. Funding was provided by the Ecole Polytechnique Fédérale de Lausanne (R.L.-C.), High Q Foundation, USA National Institutes of Health (NS045242 to R.L.-C., R.J.F.; CA74841 to C.K.; NS38166 to R.A.), Hereditary Disease Foundation, Medical Research Council UK (L.J., S.B.D), Australian National Health and Medial Research Council (A.J.H.), Biotechnology and Biological Sciences Research Council UK (L.J., A.H.), Wellcome Trust (G.P.B.), Health Research Council of New Zealand, New Zealand Neurological Foundation and University of Auckland (R.L.M.F.), VA Merit Review Grant (R.A.), Canadian Institutes of Health Research (M.A.P.), Michael Smith Foundation for Health Research (M.A.P.), Canadian Institutes of Health Research (M.R.H., B.R.L.), Huntington Society of Canada (M.R.H., B.R.L.), Canadian Genetic Diseases Network (M.R.H., B.R.L.) and the National Center of Competence in Research on Molecular Oncology, a research program of the Swiss National Science Foundation (T.S., M.D.). M.R.H. is a Killam University Professor and holds a Canada Research Chair in Human Genetics.
Conflict of Interest statement. The authors declare that they have no conflicts of interest.
